
Figure 1.
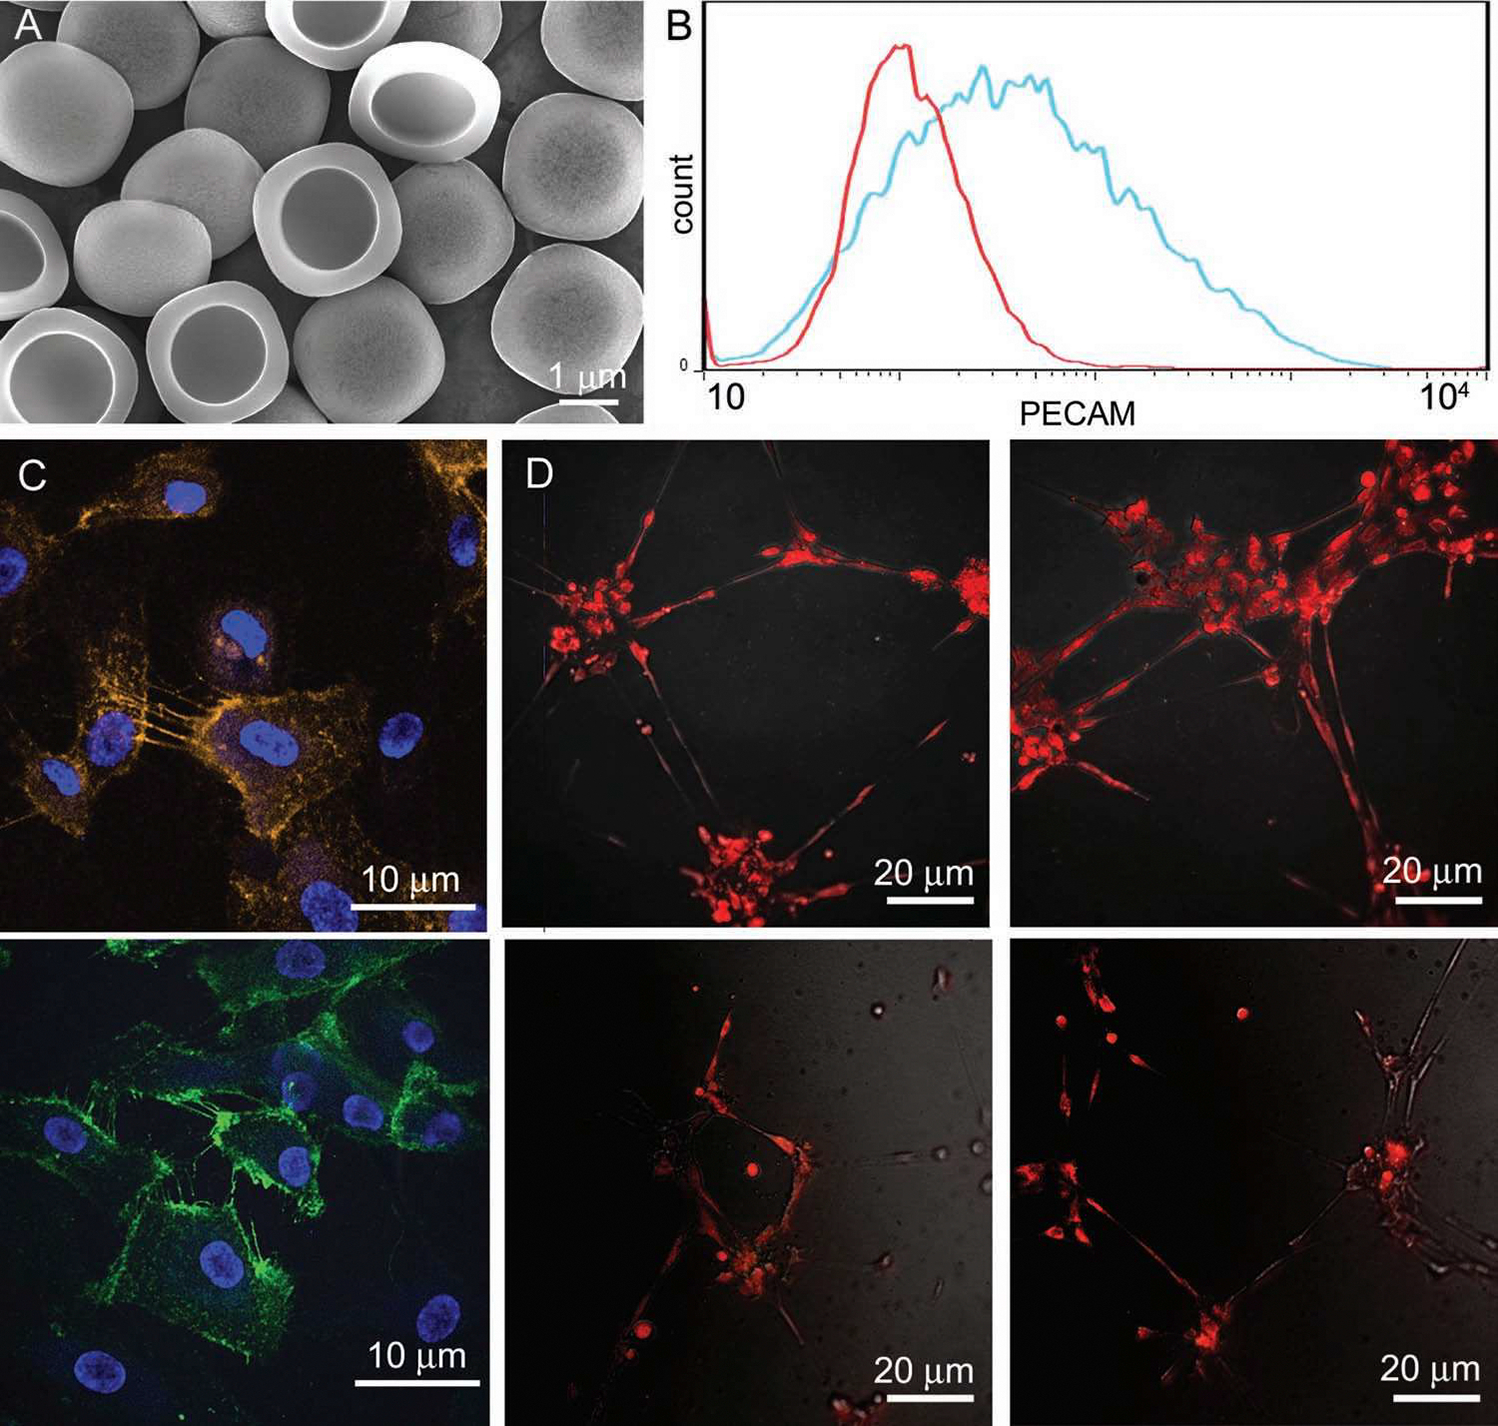
Phenotypic analysis of endothelial cells in culture. A) Scanning electron micrograph of porous silicon microparticles (mag. 10 000×; bar 1 μm). B) Flow cytometric analysis of PECAM expression by HMVEC (red–isotype control; blue–PECAM). C,D) Confocal micrographs showing PECAM expression on HMVEC (C; bars 10 μm) and endothelial tube formation by HMVEC cultured in a gel matrix (D; top row control, bottom row microparticle treated).