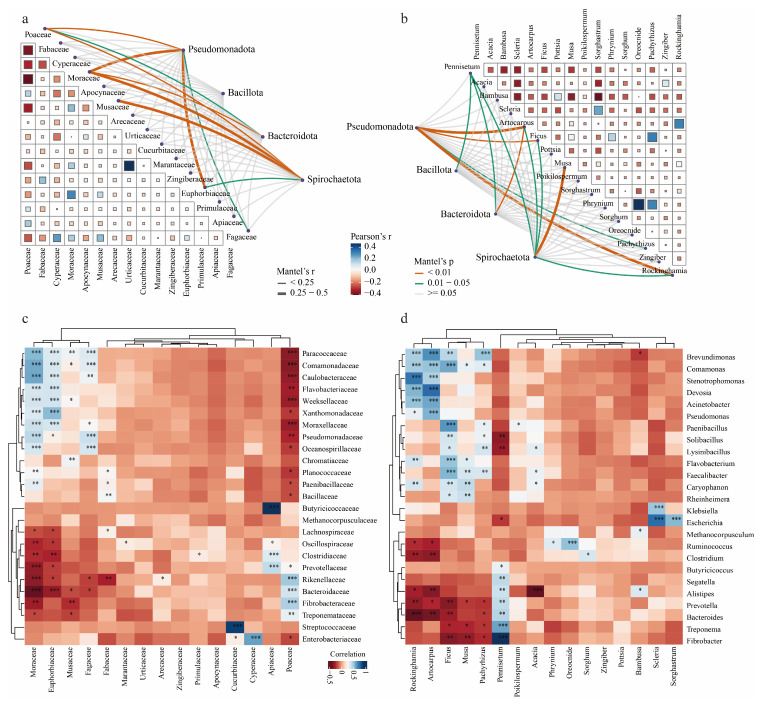
Figure 6.
Correlation analysis between gut microbiota and forage plants. (a,b) Heatmap of Mantel test correlations between the family (a) and genus (b) levels of the top 16 forage plants and the phylum level of gut microbiota. (c,d) Pearson correlation analysis of the gut microbiome dataset with the dietary dataset at the family (c) and genus (d) levels. The color gradient in the heatmap represents the Pearson correlation coefficients between the microbial abundance and dietary data, with blue indicating positive correlations and red indicating negative correlations. Significant differences detected by the Pearson correlation test; “*” indicates significant correlation; * p < 0.05, ** p < 0.01, and *** p < 0.001.

