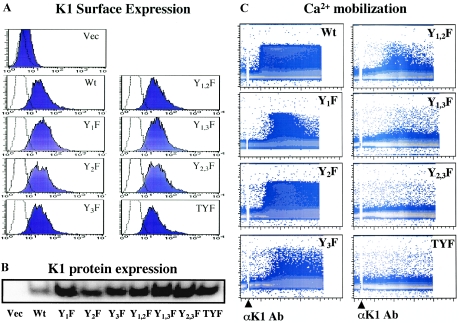
FIG. 3.
K1-mediated intracellular Ca2+ mobilization. (A) Surface expression of WT K1 and its mutant forms. BJAB cells were transfected with the pcDEF vector (Vec), pcDEF/K1, and pcDEF/K1 mutant constructs, and live cells were sorted by Ficoll-Hypaque centrifugation at 24 h posttransfection. These cells were then incubated with 1 mg/ml of G418 for 6 to 8 weeks and tested for K1 surface expression with an anti-K1 antibody. A histogram of each cell line (dark blue shaded) is overlaid with a dotted-line histogram of the anti-mouse total IgG antibody used as an isotype control. (B) WT and mutant K1 expression. WT and mutant K1 expression in BJAB cells was detected by immunoblotting with an anti-K1 antibody. (C) K1-mediated intracellular Ca2+ mobilization. Calcium mobilization was monitored over time by changes in the ratio of violet to blue (405 nm to 485 nm) fluorescence of cells loaded with indo-1 and analyzed by flow cytometry. Data are presented as a histogram of the number of cells with a particular fluorescence ratio (y axis) versus time (x axis). Arrowheads indicate the addition of anti-K1 antibody (Ab) 2H1. Ionomycin was added as a control for intracellular calcium mobilization. The breaks in the graphs indicate the time intervals during addition of antibodies. Data were similar in three independent experiments.

