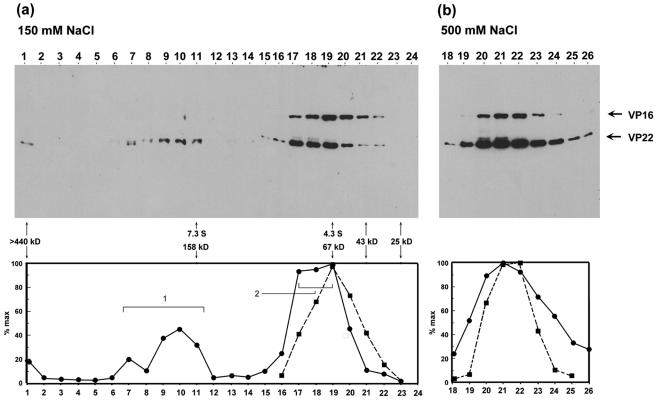
FIG. 4.
Glycerol gradient sedimentation analysis of VP22 and VP16. Extracts from infected HeLa cells (multiplicity of infection, 5) prepared as before were analyzed by glycerol gradient sedimentation in 150 mM salt buffer (panel a) or 500 mM salt buffer (panel b), as described in Materials and Methods. Fractions were collected from the bottom of the gradient and aliquots were separated by SDS-PAGE and electroblotted onto nitrocellulose and the sedimentation profiles of VP22 and VP16 gels were determined after probing with anti-VP22 and anti-VP16 antibodies. The abundance of VP22 and VP16 was measured and the profiles of VP22 (solid circles) and VP16 (solid squares) were plotted as percentages of the maximal peak versus fraction number. Peaks for VP22 are numbered as discussed in the text. The peak elution positions of the protein standards used in sedimentation analysis are shown on the graph along with their sedimentation coefficients.

