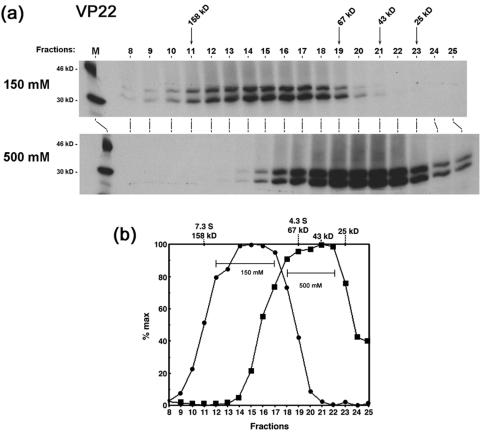
FIG. 5.
Glycerol gradient sedimentation analysis of in vitro-synthesized VP22. (a) Autoradiograph of the elution profile of in vitro-synthesized VP22 following glycerol gradient sedimentation analysis at 150 mM and 500 mM salt, as indicated. VP22 was expressed in vitro in a coupled transcription-translation system as described in Materials and Methods and the expressed product, VP22(TnT), subjected to sedimentation analysis exactly as before at a final concentration of either 150 mM or 500 mM NaCl. Aliquots of each of the fractions were separated by SDS-PAGE and the gels were subjected to autoradiography. Lane M shows 14C-labeled markers. The elution positions of the mass protein standards are shown on the top of the panel. (b) The level of VP22(TnT) in each of the fractions in the gels in panel a was measured using a PhosphorImager analysis and the intensities were plotted as a percentage of maximal fraction versus fraction number.

