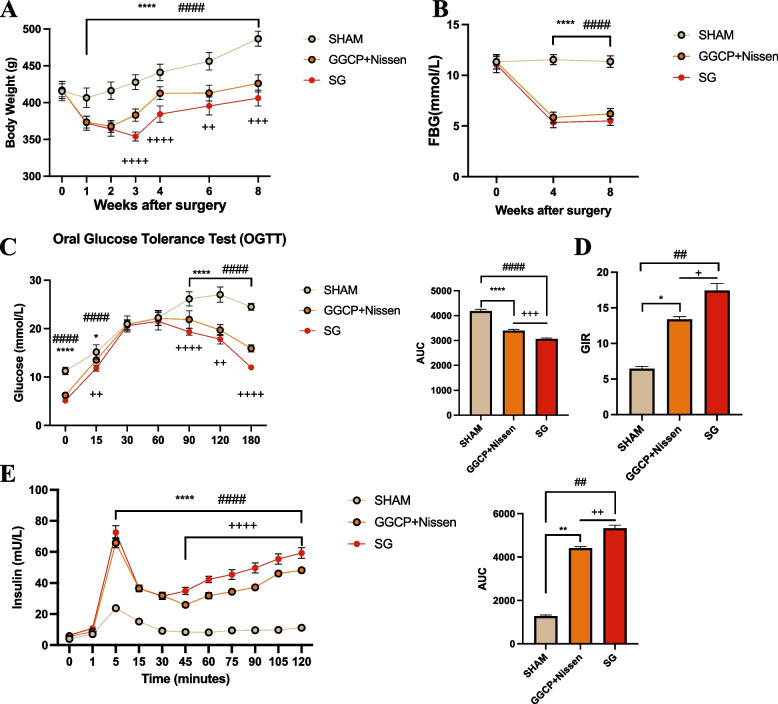
Fig. 4.
The improvement of glucose homeostasis in animal model. A Body weight after surgery. B Fasting blood-glucose after surgery. C Oral glucose tolerance after surgery. D Glucose infusion rate after surgery. E insulin level. ****P < 0.0001, ***P < 0.001, ** P < 0.01, *P < 0.05 SHAM vs GGCP+Nissen; #### P < 0.0001, ### P < 0.001, ## P < 0.01, # P < 0.05 SHAM vs SG. ++++ P < 0.0001, +++ P < 0.001, ++ P < 0.01, + P < 0.05 GGCP+Nissen vs SG

