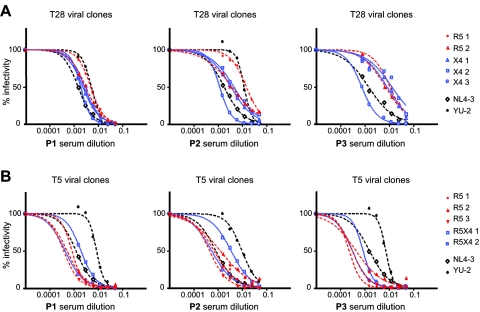
FIG. 2.
Titration curves of plasma-derived viral clones with different tropism against the three serum pools (P1, P2, and P3) from HIV-1-positive asymptomatic individuals. Percentages of infection are plotted against the serum dilutions. R5 tropic viral clones are indicated in red, and viruses using CXCR4 exclusively (X4) or in addition to CCR5 (R5X4 or dual tropic) are indicated in blue. The reference viruses NL4-3 and YU-2 are indicated in black. Values represent the mean of triplicate wells. The graphic is representative of at least two independent experiments. (A) Neutralization curves of viral clones from patient T28. (B) Neutralization curves of viral clones from patient T5.

