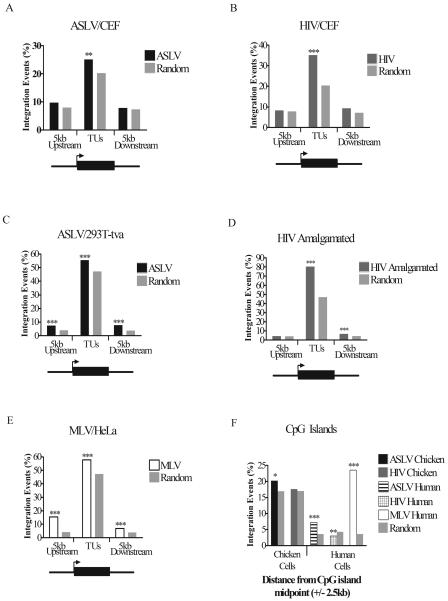
FIG. 2.
Frequency of retroviral integration in and around TUs and CpG islands: influence of cell type and retrovirus studied. The percentages of total integrations into TUs (using the “mRNA” gene catalog) and regions of DNA 5 kb upstream of the transcription start site and 5 kb downstream of the transcription end sites were plotted separately for each virus. The viruses and cell type studied are as marked above each graph. (A) ASLV in CEF cells; (B) HIV in CEF cells; (C) ASLV in human 293T-Tva cells; (D) HIV data from several human cell types (see Table 1); (E) MLV in human HeLa cells. The diagram below each graph shows the regions in and around TUs that were scored for integration events. The arrow represents the transcription start site, and the black box represents the TU. (F) The percentage of total integrations for each virus within 2.5 kb upstream and 2.5 kb downstream of CpG island midpoints compared to matched random controls. Comparison of the data on matched random control sites for human and chicken shows that a much larger fraction of the chicken genome is annotated as CpG island, perhaps an artifact of the higher G/C content of the chicken genome. If CpG islands are in fact “overcalled” in the chicken genome, then this will reduce our ability to detect biases in integration in these sites due to increased noise. P values were determined using the chi-square test and comparison to matched random controls. *, 0.01 < P < 0.05; **, 0.001 < P < 0.01; ***, P < 0.001.

