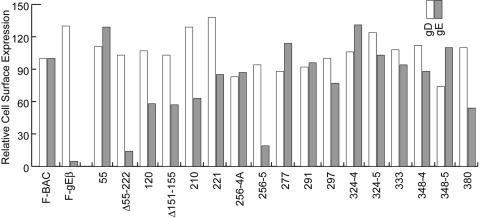
FIG. 4.
Cell surface expression of gE and gD. HaCaT cells were infected with F-BAC, FgEβ, or gE mutants for 10 h, and then the cells were removed from plastic dishes using EDTA and trypsin and stained with either anti-gD MAb DL6 or anti-gE MAb 3114 and fluorescent secondary antibodies. The cells were then characterized by FACS. The mean fluorescence for F-BAC with background fluorescence subtracted was arbitrarily set at a value of 100, and the mean fluorescence of cells infected with each mutant was compared to this value.

