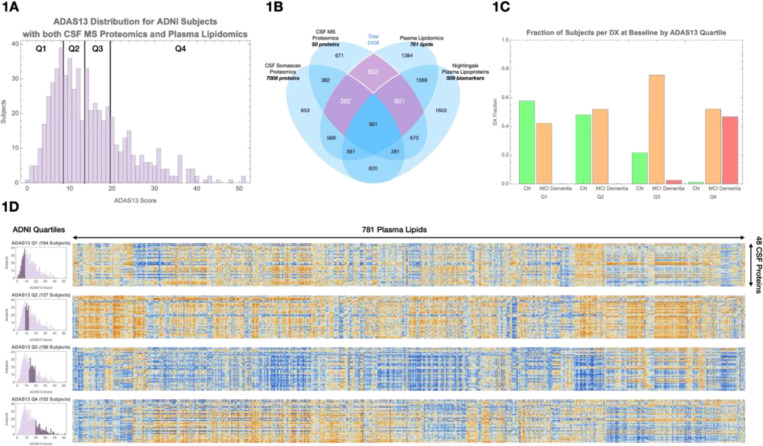
Figure 1. Overview of data selection and inter-omic correlation structure.
(A) Schematic of ADNI multiomic datasets used in this study, including plasma lipidomics, CSF mass spectrometry (MS) proteomics, CSF SomaScan proteomics, and plasma lipoprotein profiles.
(B) Selection of 602 participants with paired plasma lipidomic and CSF proteomic data; 362 had additional CSF SomaScan data, and 601 had Nightingale lipoprotein profiles.
(C) Distribution of clinical diagnoses across cognitive quartiles based on ADAS13 scores: Q1 = 1–7, Q2 = 8–12, Q3 = 13–18, Q4 = 19–52.
(D) Heatmaps of lipid–protein correlations within each cognitive quartile. Blue indicates negative correlations; orange indicates positive correlations. A visible shift in correlation patterns occurs between Q2 and Q3, corresponding to the cognitive transition from normal to mild impairment.

