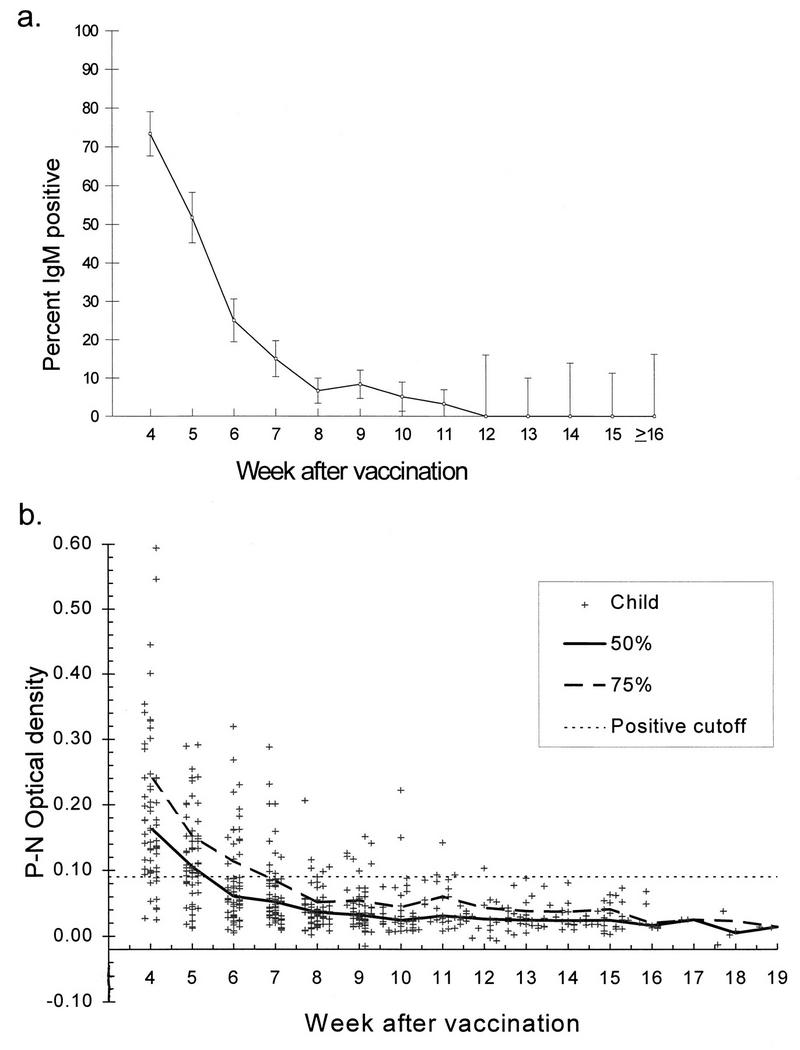
FIG. 1.

(a) Percentage of specimens that were IgM positive over time (weeks after MMRII vaccination). Vertical lines represent 95% confidence boundaries. A week was defined as a multiple of 7 ± 3 days (e.g., week 10 = 67 to 73 days). (b) Difference in optical densities of positive and negative (P-N) wells for each child by week after MMRII vaccination. The heavy solid and dashed lines show the 50th and 75th percentiles, respectively, for each week as defined above. The horizontal dashed line represents the cutoff P-N value of 0.10, which was used in combination with the P/N ratio to determine whether the specimen was considered IgM positive, borderline, or negative.
