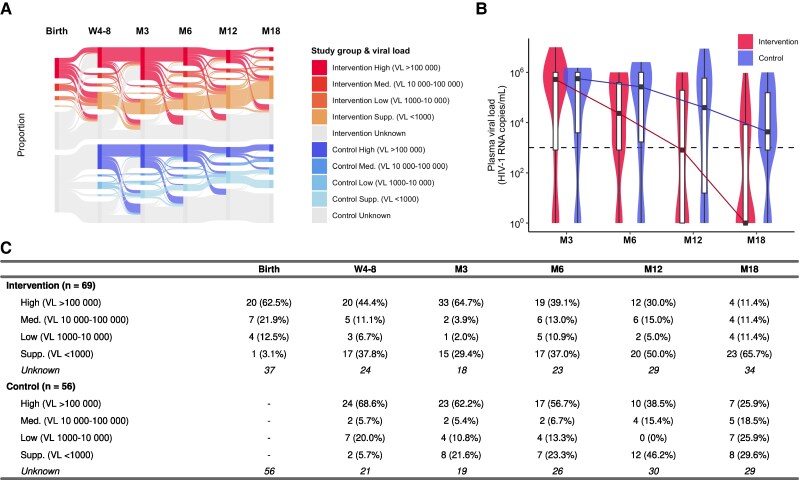
Figure 3.
A, Sankey diagram showing the proportions of infants in each viral load (VL) category by timepoint (rectangular blocks) and the size and directions of transfers between categories and timepoints (flow lines). The category “Unknown” (gray) includes infants not on antiretroviral therapy, infants who have died or were lost to retention, and infants without VL results. Proportions are calculated without including “Unknown” values in the denominator. B, Violin plots showing the distribution of log10 VL by timepoint between intervention (red) and control groups (blue). Colored lines show the change in medians. The horizontal dashed line at log10 3.0 represents the cutoff value for viral suppression. C, Frequency and proportion of infants in each VL category by timepoint. Abbreviations: HIV-1, human immunodeficiency virus type 1; M3, month 3; M6, month 6; M12, month 12; M18, month 18; Med., medium; Supp., suppressed; VL, viral load; W4-8, week 4–8.

