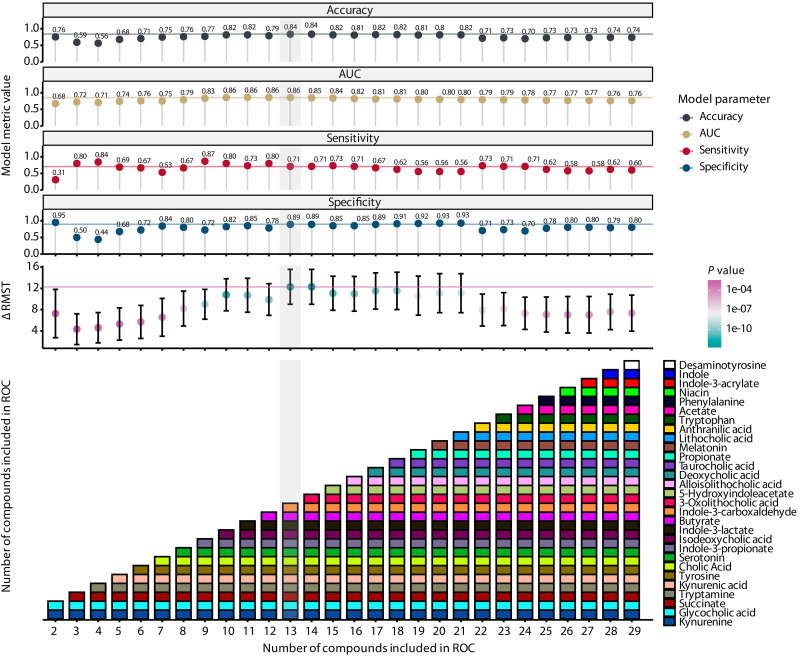
Fig. 3. Model and survival metrics of the MDS.
The top panels show accuracy, AUC, sensitivity, specificity, and the difference in RMST between low and high scores (as determined by an optimal threshold analysis) of each model. The lowest panel shows the number of compounds sequentially added into the model (x axis) with the compounds noted in each iteration (y axis and colored boxes). The order of compounds added into the scores was determined by increasing absolute β values from a ridge regression. RMST P values were determined using a log-rank test.

