

Abstract
If we want to address climate change and loss of biodiversity, we need to move toward a circular economy that uses closed-loop recyclable plastics, reduces CO2 emissions, and replaces fossil feedstocks for chemicals and materials. Fossil-based polymers can be replaced by CO2- or biobased polymers starting from monomers such as glycolic acid. Glycolic acid can be obtained from oxalic acid by the direct hydrogenation of only one of the two carboxylic acid groups with a very high selectivity up to 100%. In this work, we studied a set of improved ruthenium–tin-based two- and three-metallic catalysts. We achieved a 95% glycolic acid yield after 4 h in batch reactors (100 bar H2; 75 °C), and 100% yield at 70–100 °C and 60 bar H2 in flow reactors, with improved selectivity toward glycolic acid consistently above 90%, acetic acid formation below 5%, and improved catalyst stability in the harsh acid environment (pH < 1). We established the ideal loading and ratio of ruthenium and tin, explored the influence of supports, and showed that avoiding the presence of chloride increases the catalyst stability. We study the electronic properties of chloride-free ruthenium–tin catalysts during the reaction and identify insufficient Ru/Sn metal reduction as the main cause of catalyst deactivation. The addition of platinum as a third metal significantly improved the catalyst stability while maintaining the high activity and selectivity reducing activity loss to only 9% over multiple uses. This work enables the efficient direct reduction of oxalic acid to glycolic acid and, consequently, the utilization of CO2 and biomass-derived oxalic acid as monomers for polyesters.

Introduction
Climate change and biodiversity loss are two of the biggest challenges we face as humanity. , Fossil-based chemicals, fuels, and materials including polymers cause greenhouse gas emissions, and we pollute the biosphere such as marine life with single-use materials. , In future, we, therefore, have to produce polymers from renewable sources and design them to be closed-loop recyclable. − Next to recycling, polymers from biomass or CO2 are the only alternative to fossil sources for carbon materials. In the “OCEAN” project, we developed new processes to produce sustainable polymers based on CO2 with formate and oxalic acid as key intermediates (Figure ).
1.

OCEAN process for CO2 utilization via (i) electrochemical reduction to formate, (ii) thermal formate coupling to oxalate, (iii) electrochemical oxalate acidification, (iv) thermocatalytic reduction of oxalic acid to glycolic acid, and (v) polymer production from oxalic acid and its derivatives. Reprinted with permission from Schuler, et al., ACS Sustainable Chem. Eng. 2021, 9, 14777–14788. Copyright 2021 ACS Sustainable Chemistry and Engineering. Photo credit: Maria Murcia Valderrama.
We envision oxalic acid as a new platform chemical to produce monomers for sustainable polymers such as ethylene glycol or glycolic acid. , Oxalic acid is obtained in a three-step process involving the electrochemical reduction of CO2 to formate, the formation of oxalate from two formates in the thermal formate to oxalate coupling reaction, and last electrochemical acidification of oxalate to oxalic acid. − Especially, glycolic acid is an interesting derivative of oxalic acid. Today, it is directly used in the textile industry as a dyeing and tanning agent and in food processing as a flavoring agent and as a preservative. It bears great potential to develop sustainable polymers in the future. The glycolic acid market volume in 2020 was 310 million USD and is projected to reach 530 million USD by 2027. Several commercial routes toward glycolic acid exist today. They include the hydrolysis of methyl glycolate or glyconitrile both produced from methanol; the hydrolysis of chloroacetic acid obtained from acetic acid; and the carbonylation of formaldehyde, which today is the dominant industrial production method. − All of these routes are fed by fossil feedstocks today. In the future, fossil feedstocks need to be replaced by sustainable carbon and energy sources. Zhou et al. suggested to produce glycolic acid from ethylene glycol using biomass as a source of carbon and energy. Alternatively glycolic acid can be produced from cellulose. , Their technoeconomic analysis shows that this process is favorable to existing fossil processes. However, with growing land-use pressure in the futurewe believe that the only truly sustainable carbon source of the future is CO2. , Hence, all feedstocks for sustainable glycolic acid should be obtained from CO2 and water.
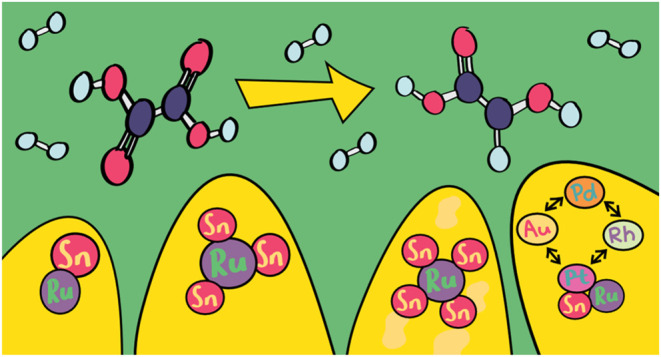
Recently, we and others showed that the elegant hydrogenation of oxalic acid to glycolic acid is possible with a ruthenium-based catalyst. ,, We also performed a species comparison for different routes from CO2 to glycolic acid. We could show that the reduction of oxalic acid proposed here has the lowest overall cost-price (USD1316; in a range from USD1316–USD2350) and is thus a valid option to produce sustainable glycolic acid in the future. Oxalic acid is more reactive than other carboxylic acids and (uniquely) can be efficiently hydrogenated at 50 °C already (60 bar of H2 in a trickle-bed flow reactor). The direct hydrogenation avoids the detour via esterification which was commonly used before. Although the low hydrogenation temperature already allowed unprecedented selectivity in the reduction reaction, acetic acid formation and the over-reduction of glycolic acid to ethylene glycol limit the achievable yields and require downstream separation (Figure ).
2.

Reaction pathways in the hydrogenation of oxalic acid. (A) Deprotonation of oxalic acid in water (pK a = 1.27), (B) desired route to glycolic acid (17.8 kJ mol–1), (C) overreduction to ethylene glycol (16 kJ mol–1), (D) formation of acetic acid (23 kJ mol–1), and (E) decomposition to volatile compounds dominant at temperatures above 120 °C.
In our preliminary work on this subject, it was found that adding tin as a secondary metal prevents the formation of acetic acid and increases the overall activity of the ruthenium-based catalyst. Ruthenium is widely used as a hydrogenation catalyst, − and the addition of tin to ruthenium-based catalysts is employed in many hydrogenation reactions. ,− Recent developments for carboxylic acid hydrogenation catalysts were nicely summarized by Tamura et al. Adding a second metal species to a catalyst can improve the catalyst performance and increase the activity or selectivity. In bi- or multimetallic catalysts, one should differentiate between the two metals forming alloys or being present as separate metal and metal oxide species, which can benefit the reaction due to the geometric or electronic effects. Adding tin to ruthenium catalysts improves the selectivity of alcohols and increases the catalyst stability. Toba et al. observed a shift in selectivity toward diol formation with higher tin contents when using different RuSn/Al2O3 catalysts with oxidation states of Ru0 and SnII. They propose that hydrogenation is separated into three steps. In the first two steps, the carboxylic group and molecular hydrogen are activated by Sn and ruthenium. The third and final step is the migration of hydrogen to the activated carboxyl group. This mechanism is different from Santos et al., who described that the carboxyl group is activated by ruthenium and molecular hydrogen is bound by activated carbon. Galvagno et al. observed that tin can have different effects on the catalytic activity which depended on the substrate. In some cases, tin blocks potential ruthenium sites. The specific activity of ruthenium for this reaction remains constant independent of the composition. Pouilloux et al. observed no change on the surface ruthenium content when varying the tin content but observed an enrichment of the tin on the surface. They attributed this to the presence of isolated tin oxides, which have no interaction with ruthenium. With temperature-programmed reduction (TPR), they measured an increase in the reduction temperature proportionate to the content of tin. Luo et al. observed different reduction temperatures, based on the molecular ratio, showing a new peak, which corresponds to the formation of SnO or SnO2 when the ruthenium–tin ratio increases, but their X-ray photoelectron spectroscopy (XPS) analysis shows no interaction between metal groups. They proposed the formation of Ru3Sn7 nanoclusters as the active site and ascribed the changes in the reactivity to the changes in the surface content of metals. The active species for these reactions however are not clear.
In this work, we report on the synthesis of a highly selective catalyst for the reduction of oxalic acid to glycolic acid that withstands harsh acidic conditions and avoids the production of acetic acid. We aim to improve the activity by employing state-of-the-art spectroscopy to gain insight into the structure of the active phase and its change throughout the reaction in batch and flow chemistry applications.
Experimental Section
Extensive details of all reactions and analysis procedures can be found in the Supporting Information. All chemicals, metal precursors, and support materials were reagent grade and obtained from Sigma-Aldrich.
We used a parallel batch reactor setup for the activity testing of the Ru–Sn catalyst with different supports and initial activity tests with the chloride-free ruthenium–tin catalysts prepared via deposition and precipitation. In this setup, sampling rates are limited, and only liquid samples can be analyzed.
We used a single 100 mL Hastelloy CSTR batch reactor to estimate the ideal ruthenium/tin ratio, test the effect of chloride removal, and find suitable tertiary metals for the catalyst. Catalyst stability was tested by performing multiple reactions using the same catalyst. For longer-term catalyst testing, we used a catalyst that allows for high sampling rates, analysis of liquid and gas phases, and monitoring of gas consumption during the reaction, yet only one catalyst could be tested at a time. We reduced the catalysts ex situ in a tubular furnace at 350–500 °C in a hydrogen atmosphere before testing.
We tested these catalysts also in a trickle-bed single-flow reactor system which allows unlimited continuous operation and the automated collection of up to 8 samples per experiment without interruption. In this reactor, the catalysts were prereduced in situ in an H2 flow at 200 °C. We sequentially studied the influence of reaction temperature (50–120 °C) and tried to recover the catalyst activity by washing the catalyst with water, ethanol, and isopropanol. In each experiment, we duplicated the measurement for each setting to guarantee reproducibility. During the optimization, we kept the length and volume of the catalyst bed, reactant concentration, pressure, feed (5 wt % oxalic acid in water), and gas flow constant.
We prepared the catalysts using different techniques to improve the catalyst stability and structure. Ru–Sn catalysts on different supports (carbon, TiO2, ZrO2, Al2O3 and Ti3(Al0.8Sn0.2)C2 MAX phase) were prepared via wet-impregnation. Different Ru–Sn ratios on carbon were realized initially by using incipient wetness impregnation. This impregnation procedure was optimized to reduce the chloride content by altering metal precursors (chloride-free), removing the chloride after impregnation in a Soxhlet or washing it with acetic acid or sodium hydroxide, or avoiding chloride deposition via direct precipitation and deposition of metals on the catalyst in solution. The direct precipitation–deposition method was used to synthesize catalysts with higher tin loadings for activity testing and physical characterization.
The reaction products were analyzed by high-performance liquid chromatography (HPLC) equipped with an RI detector, and the conversion of the oxalic acid and the selectivity toward the main reaction products were calculated. The samples were prepared by diluting them in the mobile phase and adding internal standards. A Shimadzu HPLC instrument with refractive index detector (RID) detection was used to measure the concentrations of oxalic acid, glycolic acid, glyoxylic acid, acetic acid, and ethylene glycol.
Other samples were measured using HPLC. These samples were prepared by diluting the samples in demineralized water to a theoretical stock solution concentration of 0.67 mg stock mL–1. High-performance liquid chromatography (HPLC) was used to determine oxalic acid, glycolic acid, glyoxylic acid, acetic acid, and ethylene glycol concentration on an Agilent 1260 Infinity II HPLC system equipped with an autosampler, heated column compartment, diode-array detector (DAD), and RID. The column was an Aminex HPX-87H (300 × 7.8 mm2; dp 9 μm).
To study the influence of the reaction on the catalyst, we analyzed the catalyst with powder X-ray diffraction (XRD) using a Rigaku Miniflex at an angle (2θ) of 3 to 90° at a rate of 1° min–1 and a step size of 0.05°, nitrogen adsorption (Brunauer–Emmett–Teller (BET)) at 70 K in a BELSORP-Max II (BET) pretreated at 180 °C for 6 h in vacuum. Infrared spectra of the catalyst were recorded with a Nicolet iS50R Research FTIR Spectrometer from Thermo Scientific. We used the attenuated total reflection (ATR)-module with a diamond window for both solid samples (used catalysts) and liquid samples (solvents containing blocking substances from deactivated catalysts). For processing of the IR spectra, Spectragryph version 1.2.15 was used. We used a Tornado Hyperflux Pro Raman spectrometer equipped with an Axiom RFP 400 probe and a laser with a 785 nm wavelength. The samples were analyzed at varying laser intensities starting from low (10 mW) to high (500 mW).
For catalysts that deactivated during testing, we removed the residue covering active sites with strong solvents and analyzed it with a gas chromatograph. We used a PerkinElmer Clarus 500, equipped with a flame ionization detector and a 30 m Agilent polysiloxane HP-5 column (0.32 mm ID, 0.25 μm) with helium as the carrier gas. Mass spectra of the residue were analyzed using HR-ToF Bruker Daltonik GmbH (Bremen, Germany) Impact II, an electrospray ionization time-of-flight mass spectrometry (ESI-ToF MS) capable of a resolution of at least 40 000 full width at half-maximum (fwhm). Detection was in positive-ion mode, and the source voltage was between 4 and 6 kV. The sample was introduced with a syringe pump at a flow rate of 18 μL h–1. To analyze the residue with nuclear magnetic resonance (NMR), we washed the catalysts with strong deuterated solvents of either dimethyl sulfoxide-d 6 or deuterated chloroform and measured the spectra using an AV300 NEO from Bruker. For the processing of the NMR spectra, TopSpin version 4.1.1 is used. To determine whether carbonous substances were blocking the catalyst, we used a Mettler Toledo TGA/DSC 3+ to perform thermogravimetric analysis of 20 mg fresh and used catalyst in an aluminum crucible.
We analyzed liquid product samples for the presence of leached Ru after performing a reaction in the trickle-flow with an Avio200 optical emission spectrometer of PerkinElmer using Yttrium as an internal standard.
We studied the fresh and used catalysts using high-resolution scanning transmission electron microscopy (HRSTEM) images and chemical composition mapping with atomic resolution by electron energy loss spectroscopy (STEM-EELS). The images were taken using a high angular annular dark field (HAADF) detector in a probe-corrected FEI Titan 60–300 operated at 300 kV and equipped with a high brightness X-FEG and a CESCOR Cs-probe corrector allowing for the formation of an electron probe of mean size of 0.09 nm. We also used X-ray photoelectron spectroscopy (XPS) analyses using a SPECS Phoibos 100 MCD5 hemispherical electron analyzer operating at a constant pass energy. The X-ray source employed was Kα Mg (1253.6 eV), and a flood electron gun was also necessary to compensate charge effects on the Ru–Sn/C catalysts. Survey and high-resolution spectra were carried out with an energy pass of 90 eV and step energy of 1 eV and with an energy pass of 30 eV and step energy of 0.1 eV, respectively. Binding energies, referenced to the C 1s line at 284.6 eV, have an accuracy of ±0.1 eV. In addition, we produced scanning electron microscopy (SEM) images and energy-dispersive X-ray (EDS) analyses were performed with a JEOL JMS-6610LV using a 20 kV accelerating voltage. Before being analyzed, the Ru–Sn/C catalysts were sputtered with gold to make them electrically conductive.
Results and Discussion
In our previous work, we reported, that adding tin as a secondary metal prevents the formation of acetic acid and increases the overall activity of the catalyst. In this work, we used this initial lead to improve the catalyst by exploring the effect of support, the ruthenium–tin ratio at constant ruthenium loading, and different catalyst synthesis strategies. We first explored the impact of changing these parameters solely on the performance level. We used batch-type reactors and used a constant ruthenium loading which we optimized previously. In the second stage, we prepared the most promising catalysts, tested them in flow reactors, and conducted spectroscopic studies to resolve the molecular structure of the catalyst and the eventual changes the catalyst incurs during the reaction. At last, we show how the catalysts for this reaction could be improved further in the future by adding a third active metal.
Optimization of the Ruthenium–Tin Ratio and Support Effect
The amount of tin per ruthenium on the catalyst determines the probability of the formation of bimetallic structures. In our previous work, we used the ruthenium–tin ratio of 1:0.2. To study the effect of different metal ratios, we synthesized catalysts with the ruthenium–tin ratio of 1:0.1 to 1:1.5 (details see SI 3.1). We tested them in a 100 mL CSTR-type Hastelloy reactor (details see SI 4.2, 7.1). Increasing the ruthenium:tin ratio to 1:0.4 increased the conversion (Figure C). Further addition of tin did not increase the catalyst activity. The production of acetic acid declined with an increasing amount of tin, and no acetic acid was formed above a ruthenium–tin ratio of 1:0.4 (Figure D).
3.

Performance of Ru–Sn catalysts with varying support materials and ruthenium–tin ratios. (A) Conversion of 5 wt % oxalic acid in water after 2, 4, and 6 h of reaction with Ru–Sn catalysts with varying supports in the Batchington reactor at 75 °C, 100 bar H2, 1.5 mL oxalic acid solution, 50 mg catalyst. (B) Carbon balance after reaction in (A). (C) Conversion of oxalic acid with equimolar Ru–Sn catalysts with varying ruthenium to tin ratios on carbon in a 100 mL Hastelloy reactor at 75 °C, 100 bar H2 after 6 h. (D) Carbon balance after reaction in (C).
To study the effect of the support, we synthesized Ru–Sn catalysts on TiO2, ZrO2, Al2O3, and Ti3(Al0.8Sn0.2)C2 MAX phase with equimolar amounts of each metal. For ease of preparation, we used a simple wet-impregnation technique (for details, see SI 3.2). The absence of clear peaks of the active metals in the XRD analysis (Figure A) suggests that the particles were too small to be detected or existed as amorphous alloys. The supports differ in acidity and surface area, as shown by adsorption measurements (details SI 5.2). The carbon support had the highest surface area, which was 2 orders of magnitude higher compared to the Ti3(Al0.8Sn0.2)C2 MAX phase with the smallest surface area (Table ). We tested the catalysts in a parallel batch reactor setup (Figure A,B; details in SI 7.2). All catalysts except RuSn/Al2O3 were active and produced glycolic acid selectively, without forming acetic acid (Figure B). Glyoxylic acid was observed in minor amounts with the MAX support. Interestingly, the RuSn/C and RuSn/Ti3(Al0.8Sn0.2)C2 MAX phases were the most active although they had very different surface areas (Table ). We conclude that the surface area of the catalyst did not appear to affect the activity (Figure A). RuSn/TiO2 and RuSn/ZrO2 were less active but still highly selective toward glycolic acid. We chose to continue with carbon support due to their high activity and selectivity.
12.

X-ray diffraction (XRD) spectra of (A) Ti3(Al0.8Sn0.2)C2 MAX phase and RuSn/Ti3(Al0.8Sn0.2)C2 MAX (5 wt %), TiO2 and RuSn/TiO2 (5 wt %), carbon and RuSn/carbon (5 wt %) prepared via wet-impregnation. (B) Ru1Sn1/C, Ru1Sn2.3/C and Ru1Sn4/C and carbon all prepared by direct precipitation and deposition.
1. Surface Area, Pore Volume, and Pore Diameter of Different Ruthenium Catalysts Determined by Nitrogen Adsorption–Desorption Measurements.
| catalyst | surface area (m2 g–1) | pore volume (cm3 g–1) | average pore diameter (nm) |
|---|---|---|---|
| activated carbon (C) | 865 | 0.60 | 1.4 |
| Ru/C | 1030 | 0.71 | 1.4 |
| Ru1Sn1/C | 1097 | 0.76 | 1.4 |
| Ru1Sn1/C | 929 | 0.66 | 1.4 |
| Ru1Sn2.3/C | 780 | 0.58 | 1.5 |
| Ru1Sn4/C | 755 | 0.56 | 1.5 |
| Ti3(Al0.8Sn0.2)C2 MAX | 0.6 | 0.02 | 56.3 |
| Ru/Ti3(Al0.8Sn0.2)C2 MAX | 11 | 0.03 | 5.5 |
| Ru1Sn1/Ti3(Al0.8Sn0.2)C2 MAX | 17 | 0.03 | 3.5 |
| TiO2 | 101 | 0.73 | 14.5 |
| Ru/TiO2 | 15 | 0.16 | 22.5 |
| Ru1Sn1/TiO2 | 17 | 0.15 | 17.5 |
Prepared by wet-impregnation.
Prepared by direct precipitation–deposition.
Improving Stability and Selectivity via Catalyst Synthesis
To determine the stability of the catalyst operating in a highly acidic environment of the aqueous oxalic acid substrate, a “multiple use test” was developed where the same charge of the catalyst was used in three consecutive reactions in the CSTR Hastelloy reactor without the exposure of the catalyst to air. Unfortunately, the incipient wetness preparation method used for the catalyst synthesis did not yield a stable catalyst over multiple uses as shown in Figure A. Analysis of the reaction solutions after 6 h reaction time with inductively coupled plasma optical emission spectroscopy (ICP-OES) (details see SI 5.4) showed an increasing content of ruthenium and an even higher amount of tin (3×) which suggests that a more aggressive reduction of the catalyst was probably needed (Table S1). As a first step, we increased the reduction temperature from 300 to 400 °C but still 50% of the activity was lost already at the third use.
4.

Influence of catalyst synthesis on oxalic acid reduction. (A) Deactivation of the catalyst during continuous use without chloride removal (5 wt % Ru 3 wt % Sn/C) over multiple uses. (B) Activity and deactivation of 5 wt % Ru 6.5 wt % Sn/C catalyst during continuous use synthesized with varying strategies to produce a highly active and stable catalyst with low chloride content (turquoise: strategies include removal with acetic acid after catalyst synthesis, yellow: removal with NaOH, green: removal in Soxhlet after synthesis, purple: removal during synthesis using a precipitation deposition method, pink: use of chloride-free precursors). (C) Influence of the ruthenium–tin ratio on activity and stability in chloride-free catalysts. (D) Influence of temperature for catalyst rereduction after NaOH wash on the activity during multiple uses with 5 wt % Ru 6.5 wt % Sn/C as a catalyst.
In the search for a solution, we altered the synthesis method and tried to remove the remaining chloride from the catalyst. Chlorides on ruthenium catalysts are known to inhibit the adsorption and activation of hydrogen and hamper the reduction of ruthenium and other active metals as they withdraw electrons. − Overall, we used five different approaches to produce chloride-free and stable catalysts and tested them in the 100 mL Hastelloy reactor (details in SI 7.3). In the first attempt, we synthesized the same catalyst but started with chloride-free precursors tin(II) acetylacetonate and ruthenium nitrosyl nitrate (details see SI 3.3). This produced an unstable catalyst which strongly colored the reaction solution and quickly lost all activity. We then changed the tin precursor to tin acetate. The resulting catalyst had 29% higher activity and only a 9% activity loss over time (Figure B) which shows the importance of chloride removal. Using chloride-free precursors, however, requires double impregnation with the intermittent removal of acetic acid due to the incompatibility of the precursors.
We aimed to produce an active and stable catalyst by removing chloride during synthesis. Efficient chloride removal can be achieved by a Soxhlet extraction. We first prepared the catalyst with incipient wetness impregnation, reduced it in a tubular furnace, extracted the chlorides in a Soxhlet, dried the catalyst in a vacuum oven, and rereduced it in a hydrogen atmosphere (details see SI 3.4). This resulted in a catalyst with very high initial activity and the full conversion of oxalic acid in the first use but the strongest loss in activity (Figure B)
As a next approach, the already reduced catalyst was washed with either acetic acid or sodium hydroxide solution, vacuum-dried, and then rereduced the resulting sample in hydrogen by the standard reduction protocol (details see SI 3.5 and 3.6). Washing with acetic acid increased the activity by 20% but showed a similar deactivation as nonwashed catalyst. Sodium hydroxide proved to be a better washing solution, yielding a 25% increase in activity and lower deactivation (Figure B).
We found that the rereduction of the catalyst after removing the remaining chlorides improves the catalyst activity and stability. The ideal rereduction temperature in a tubular furnace was 400–450 °C for 3 h (Figure D, details in SI 3.7 and 7.4). The reduction temperature did not affect the selectivity but reduced the loss of catalyst activity.
We re-evaluated the ideal tin content for chloride-free catalysts (Figure C). Lowering the ruthenium/tin ratio from 1:1.3 to 1:0.6 led to a continuous improvement of the catalyst activity. The maximum catalyst activity is still centered at a ruthenium/tin ratio of 1:0.85. Below a ratio of 1:0.85, a significant loss in activity for the second and third uses was observed. This shows that the amount of Sn incorporated into the catalyst affects the overall stability of the catalyst.
In the last attempt to obtain a stable and selective catalyst, we prepared the catalyst using a different synthesis strategy and directly coprecipitated the ruthenium and tin from chloride precursors onto the support (details in SI 3.8). Ideally, the chlorides are not precipitated and remain in solution. The metals are already reduced during the synthesis by the addition of sodium borohydride as a reducing agent. Subsequent washing, drying, and reduction steps are not required (Figure B).
The catalyst synthesized via direct precipitation and deposition showed the highest activity, only slightly higher deactivation, and otherwise similar performance as the catalyst produced from more expensive chloride-free precursors. We decided to use this synthesis approach to produce three Ru–Sn catalysts with different ruthenium–tin ratios to study further their performance in a trickle bed reactor in a true continuous mode of operation.
Structure and Performance of RuSn Catalysts in a Flow Reactor
To gain insight into the fundamental properties such as the physical and electronic structure of the RuSn catalyst, we prepared three types with different tin ratios, tested them in batch-type reactors and fixed-bed trickle-flow reactors and analyzed the catalysts before and after the reaction using a broad array of spectroscopic and other techniques. For ruthenium and tin, three stable alloys with the elemental molar ruthenium–tin ratios of 1:1, 1:2.3 (3:7), and 1:4 have been reported and were attributed to the role of the active phase in carboxylic acid reductions. We aimed to produce these alloys specifically by direct coprecipitation of ruthenium and tin in the molar ratios from solution on commercial carbon support (details see SI 3.9).
To precipitate the metals, we reduced the ions by slowly adding a sodium borohydride solution. The catalyst particles were then filtered, washed with water, dried, and reduced. Nitrogen adsorption measurements (details see SI 5.2) show that increasing the tin-loading from 5.8 wt % (Ru1Sn1/C) to 13.3 wt % (Ru1Sn2.3/C) and 23.2 wt % (Ru1Sn4/C) led to a 20% reduction of catalyst surface area and a small reduction in pore volume (Table ).
With temperature-programmed reduction measurements (TPR, details see SI 5.8), we observed different reduction behaviors for the three catalysts indicating the presence of different metal species (Figure ). The overall reduction peaks for all samples are very broad and stretch from 180 to 380 °C. A second broad peak from 380 to 450 °C with a maximum of 450 °C, which is visible in Ru1Sn2.3/C and even bigger in Ru1Sn4/C. We attribute this peak at 450 °C to the reduction of SnO particles close to RuO2. Hence, a reduction temperature higher than 400 °C and better at 450 °C is required to form Ru3Sn7 alloys as tin and ruthenium need to be present in their metallic form. , The absence of a clear peak at 150 °C indicates the absence of ruthenium chloride and the presence of ruthenium oxide species. The broad peak has a maximum at 240 °C and a shoulder at 338 °C in all three catalysts. Ru1Sn2.3/C shows another even bigger peak at 280 °C. The peak at 240 °C indicates the interaction of ruthenium and tin which causes a shift in the reduction temperature of ruthenium further to tin. ,, The ruthenium–tin ratio determines this shift of the reduction temperature. In combination with the previous work on the ideal reduction temperature, we decided to reduce the catalysts at 450 °C.
5.

Temperature-programmed reduction of ruthenium tin catalysts from 150 to 550 °C.
For preliminary activity tests in the batch-type reactor system (details in SI 7.6), we used 50 mg of each catalyst (Ru1Sn1/C, Ru1Sn2.3/C, and Ru1Sn4/C) with 1.11 mL oxalic acid in 2 mL water. All three catalysts showed good activity and selectivity toward glycolic acid. We used identical loadings of ruthenium per oxalic acid, and the Ru1Sn2.3/C catalyst was most active with 95% glycolic acid yield after 4 h (Figure S2).
We decided to first test the most active catalyst Ru1Sn2.3/Sn in the trickle-bed flow reactor (described in detail in SI 4.1). We examined the stability and performance in a temperature range of 50–120 °C (details in SI 7.7). The conversion increased and reached 100% at 70 °C, and only glycolic acid was formed (Figure ). The previously observed formation of acetic acid and over-reduction of glycolic acid to ethylene glycol was avoided. For the first time, we reached 100% glycolic acid yield at 70–100 °C.
6.
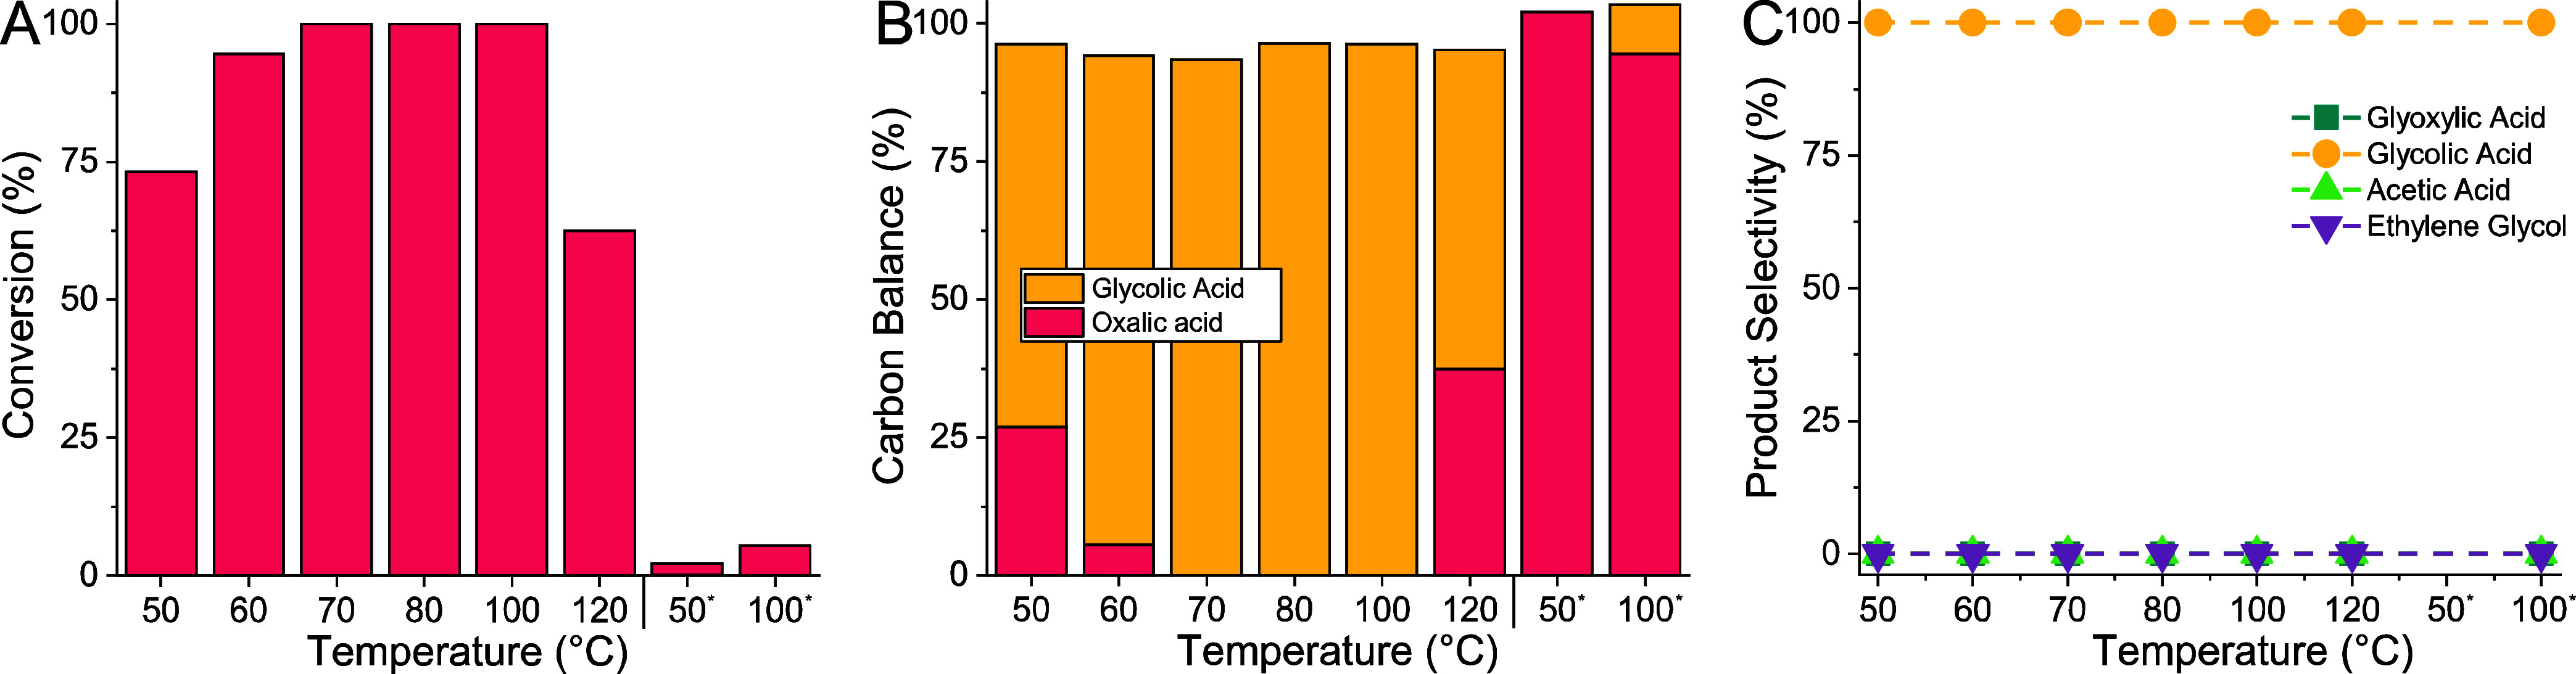
Oxalic acid reduction in a trickle-bed flow reactor with a Ru1Sn2.3/C catalyst at different temperatures. Oxalic acid conversion (A), carbon balance (B), and product selectivity (C) data as obtained by liquid chromatography (LC). Conditions during reactions: catalyst = Ru1Sn2.3/C calcined ex situ at 450 °C for 3 h and in situ at 200 °C for 2 h; temperature = 50–120 °C; pressure = 60 bar H2; substrate = oxalic acid (5 wt %) in water; flow of feed = 0.1 mL min–1; flow of gas (H2) = 200 mL min–1.
As we increased the temperature further, the catalyst seemed to degrade and the conversion dropped by 38%. We repeated the reaction at 50 and 100 °C, but the catalyst now appeared almost fully deactivated. To avoid deactivation, we tested the Ru1Sn1/C and Ru1Sn4/C only between 50 and 80 °C (for details see SI 7.8 and 7.9). The Ru1Sn1/C catalyst showed increased conversion with increasing temperature, but the overall activity was lower which decreased further over time (Figure ). Higher activity was observed with the Ru1Sn4/C catalyst, which showed an increase in conversion with temperature with a maximum of 79% at 80 °C, and 100% selectivity toward glycolic acid (Figure ). Unfortunately, this catalyst also deactivated, although much less, as the second series of 50–80 °C shows (Figure A).
7.

Oxalic acid reduction in a trickle-bed flow reactor with a Ru1Sn1/C catalyst at different temperatures. Oxalic acid conversion (A), carbon balance (B), and product selectivity (C) data as obtained by liquid chromatography (LC). Conditions during reactions: catalyst = Ru1Sn1/C calcined ex situ at 450 °C for 3 h and in situ at 200 °C for 2 h; temperature = 50–120 °C; pressure = 60 bar H2; substrate = oxalic acid (5 wt %) in water; flow of feed = 0.1 mL min–1; flow of gas (H2) = 200 mL min–1.
8.

Oxalic acid reduction in a trickle-bed flow reactor with the Ru1Sn4/C catalyst at different temperatures oxalic acid conversion (A), carbon balance (B), and product selectivity (C) data as obtained by liquid chromatography (LC). Conditions during reactions: catalyst = Ru1Sn4/C calcined ex situ at 450 °C for 3 h and in situ at 200 °C for 2 h; temperature = 50–120 °C; pressure = 60 bar H2; substrate = oxalic acid (5 wt %) in water; flow of feed = 0.1 mL min–1; flow of gas (H2) = 200 mL min–1.
To probe the cause of deactivation, we carried out further analysis. We first studied whether the active sites of the catalysts were blocked. We washed the catalyst with water at room temperature for 2 h but could not recover any activity (Figure S1, details in SI 7.10). We then changed the washing agent to alcohol as the washing agent. We washed the catalyst first with ethanol and then with isopropanol at 25 °C for 2 h each (details in SI 7.11). As Figure shows, we could recover the activity and observe a high conversion of 87% again. However, the activity decreased again quickly and conversion was below 50% after 6 h. To understand the reactivation better, we analyzed the washing solution with FTIR and LC (details in SI 5.9 and 6.4). We analyzed the deactivated catalysts with XRD, IR, TPR, and DSC. Also, we analyzed the solvents after washing in NMR (details in SI 7.12). IR and LC analyses of the washing solution did not show the presence of any material blocking the active sites. The analysis of the deactivated catalyst with IR, XRD, and Raman analysis found no indication of any surface-blocking material. The washing of the deactivated catalyst did not show any active site-blocking substances in NMR. However, the XRD spectra (Figure ) indicated the formation of larger ruthenium and tin particles.
9.

Oxalic acid reduction in a trickle-bed flow reactor and reactivation of the Ru1Sn2.3/C catalyst by washing with ethanol and isopropanol oxalic acid conversion (A), carbon balance (B), and product selectivity (C) data as obtained by liquid chromatography (LC). Conditions during reactions: catalyst = Ru1Sn2.3/C calcined ex situ at 450 °C for 3 h and in situ at 200 °C for 2 h washed with ethanol for 2 h and then with isopropanol for 2 h; temperature = 70 °C; pressure = 60 bar H2; substrate = oxalic acid (5 wt %) in water; flow of feed = 0.1 mL min–1; flow of gas (H2) = 200 mL min–1.
We hence studied the morphology and electronic structure of the catalysts and their changes during the reaction. The fresh and spent catalysts were analyzed with SEM (Figure ) and high-resolution transmission electron microscopy (HRTEM) (Figure ). These measurements were then complemented with chemical distribution mapping via energy-dispersive X-ray spectroscopy in the same instruments (for details, see SI 5.5 and 5.7).
10.

Results of scanning electron microscopy (SEM) and energy-dispersive X-ray (EDX)-mapping measurements on (A) fresh Ru1Sn1/C catalyst prepared by direct precipitation–deposition, (B) Ru1Sn1/C catalyst used for the hydrogenation of 5 wt % oxalic acid in water in batch-type reactor at 75 °C, 100 bar H2, 6 h, (C) fresh Ru1Sn2.3/C catalyst prepared by direct precipitation–deposition, (D) Ru1Sn2.3/C catalyst used for the hydrogenation of 5 wt % oxalic acid in water in the batch-type reactor at 75 °C, 100 bar H2, 6 h, (E) fresh Ru1Sn4/C catalyst prepared by direct precipitation–deposition, and (F) Ru1Sn4/C catalyst used for the hydrogenation of 5 wt % oxalic acid in water in the batch-type reactor at 75 °C, 100 bar H2, 6 h.
11.

High-resolution scanning transmission electron microscopy (HRSTEM) images and chemical composition mapping of (A) fresh Ru1Sn1/C catalyst prepared by direct precipitation and deposition, (B) Ru1Sn1/C catalyst used for the hydrogenation of 5 wt % oxalic acid in water in the batch-type reactor at 75 °C, 100 bar H2, 6 h, (C) fresh Ru1Sn2.3/C catalyst prepared by direct precipitation and deposition, (D) Ru1Sn2.3/C catalyst used for the hydrogenation of 5 wt % oxalic acid in water in the batch-type reactor at 75 °C, 100 bar H2, 6 h, (E) fresh Ru1Sn4/C catalyst prepared by direct precipitation and deposition, and (F) Ru1Sn4/C catalyst used for the hydrogenation of 5 wt % oxalic acid in water in the batch-type reactor at 75 °C, 100 bar H2, 6 h.
In the SEM-EDX images in Figure , we can see an even distribution of the two metals for all three catalysts before and after the reaction. No chloride or boron (from the reducing agent NaBH4) was incorporated into the samples. Interestingly, the metal ratios on the surface did not correspond to the ratio of the metal deposited on the support (Table ). The surface metal ratio of the most active Ru1Sn2.3/C catalyst was 1:0.8 instead of 1:2.3. This corresponds to the ruthenium–tin ratio of 1:0.85 which showed the best activity and selectivity earlier and stayed stable after the reaction, although the surface content of ruthenium increased during the reaction. The catalyst particles themselves were too small to be resolved in SEM.
2. Molar Metal Ratio and Tin Loading on Catalyst Surface Measured by SEM-EDX and XPS.
| fresh
catalyst |
used
catalyst |
|||
|---|---|---|---|---|
| desired catalyst | EDX (Ru/Sn) | surface tin-loading (XPS) | EDX (Ru/Sn) | surface tin content (XPS) |
| Ru1Sn1/C | 1:0.54 | 0.14 | 1:0.57 | 0.05 |
| Ru1Sn2.3/C | 1:0.81 | 0.23 | 1:0.82 | 0.08 |
| Ru1Sn4/C | 1:1.24 | 0.26 | 0.16 | |
No tin and ruthenium left on the catalyst as proven by XPS.
In the HRTEM (Figure ), we see spherical metal particles with an average diameter of below 5 nm on the fresh catalysts. The locations of tin and ruthenium coincide and the different tin-to-ruthenium ratios did not influence the metal distribution or particle size during synthesis. During use in the batch-type reactors, the particles appear to degrade and form needle-like structures with a length of up to 50 nm (Figure ). The HRTEM-EDS images suggest that these needles mainly consist of ruthenium. No needles were observed after the reaction in the trickle-bed flow reactor after similar exposure times to oxalic acid and at equal temperatures (Figure S3). Instead, large spherical particles with a diameter of 50–100 nm are formed, detectable also by XRD (Figure ). In contrast to the needles formed in the batch reactor, the large spherical particles consist of ruthenium and tin.
In the XRD analysis (Figure , details see SI 5.1), we identified SnO in all samples and RuO2 in the Ru1Sn4/C. In none of the samples did we see any indication of the presence of the Ru3Sn7 alloy. Unfortunately, the main peaks for metallic ruthenium and SnO overlay the peaks of the carbon support. Due to the small size of the metal particles in the fresh catalysts (below 5 nm), also shown in the SEM and TEM analyses, they are not detectable. Only the Ru1Sn4/C catalyst shows a clear peak for SnO. In the catalysts which was used a trickle-bed reactor (and deactivated over the course of the reaction), however, the formation of larger particles of RuO2 and SnO is observed (Figure B).
The XPS study reveals the surface composition and the electronic structure (Figure and Table ; for experimental details, see SI 5.6). The binding energy for ruthenium (Ru 3d5/2 and Ru 3d3/2) and the carbon support (C 1s) overlay. This overlay makes the quantification of ruthenium in the broad spectrum not possible. The overall loss of ruthenium and tin is visible in the XPS spectra (Figure ). The peaks of Ru 3d3/2 and 3d5/2 were separated by approximately 4.1 eV. We observe only one species of ruthenium with a binding energy of 282.7 eV (Ru 3d5/2). Hence, ruthenium is present as Ru(IV) or RuO2 and not metallic ruthenium or the Ru3Sn7 alloy, which is in line with the findings in the XRD measurements (Figure ). In the Ru1Sn4/C catalyst, barely any ruthenium remains on the catalyst surface after the reaction. For the Ru1Sn2.3/C catalyst, ruthenium loss appears to be the smallest. Like the ruthenium needle formation observed in HRTEM, the XPS data do suggest interaction on the molecular level only for the fresh catalysts (Figure ). Pouilloux et al. proposed a shift of 1.7 eV to lower energies for the Sn(IV) from (486.7–485 eV) if the tin particles are in direct contact with ruthenium (SnO x ). We observe a smaller shift of 0.9–1.1 eV for Sn(IV) in all fresh catalysts, but the Sn(IV) in the used species had a binding energy of 486.7 eV and is not in contact with ruthenium (SnO y ). This indicates that originally, ruthenium–tin species are present but degraded throughout the reaction. The decreasing intensity of the peaks also indicates that these isolated tin oxide species are also removed from the surface during the reaction (Table ).
13.

X-ray photoelectron spectroscopy (XPS) analyses of fresh and used Ru1Sn1, Ru1Sn2.3 and Ru1Sn4 on carbon catalysts. aAssignment of the C 1s sp2 an sp3 spectra following Lesiak et al. bAssignment of C 1s CO, O–CO and C–O/C–N following Fulvio et al. and Cattaneo et al. ,
The analysis confirms that we synthesized catalysts with well-distributed tin and ruthenium metal nanoparticles and avoided chloride in the structure. The ratio of tin and ruthenium at the surface did not correspond to metal ratios used during synthesis, and more ruthenium was present at the surface. While tin and ruthenium did not form an alloy, they were in direct contact initially as shown in XPS. However, the metal species were separated locally and oxidized during use. The tin species appear to be mainly leached from the catalyst or moved from the surface toward the inside of the catalyst (XPS), and the ruthenium appears to form needle-like structures during the oxalic acid reduction in batch reactors. In flow reactors, we did not observe the formation of needles in the flow reactor but rather agglomeration in spherical bulky particles. It seems that hydrodynamics, the residence time of the reactants, and the gas-to-liquid ratio within the reactor affect the behavior of the catalyst since no needles were found in the trickle-bed reactor.
Overall, the bimetallic ruthenium tin catalysts suffer from deactivation, which can be related to structural changes of the active metal species and the lack of formation of stable structures or alloys, most likely due to a lack of sufficient reduction of the metals.
Trimetallic Ruthenium–Tin Catalysts
Our XPS and TPR analysis showed the insufficient reduction of the active metals on the catalyst, but higher reduction temperatures lead to less active catalysts, potentially due to the sintering of the active metals which become mobile on the support or even evaporate (Sn) at higher temperatures. The resulting metal oxides (especially SnO) appeared unstable and leached off of the catalyst. Adding a third noble metal to a catalyst is known to improve the reducibility and stability of these catalysts. − We started by adding 3 wt % of different noble metals (Pt, Au, Pd, and Re) to 5 and 5.9 wt % Sn/C catalyst (details see SI 3.10).
In Figure A,B, we show the relative activity of the promoted catalyst system when used in four consecutive cycles (for details, see SI 7.13). We only show conversion values as glycolic acid was produced at 100% selectivity. After 20 min (Figure A), the loss in conversion is similar for all catalysts. The platinum-promoted catalyst is the most active and stable, the palladium-promoted catalyst performs worst. If the reaction is performed for 1 h the platinum-promoted catalyst was the most active and only lost 9% of its activity over four uses. The addition of other noble metals decreased the stability of catalysts compared to the Ru–Sn catalyst. Potentially by preventing the formation of stable alloys or contact between the nanoparticles of the Ru–Sn catalysts.
14.

Trimetallic catalyst for the reduction of oxalic acid to glycolic acid. Effect of addition of 3 wt % of Pt, Au, Pd or Re to 5 wt % Ru 5.9 wt % Sn/C catalyst on deactivation during continuous use in oxalic acid reduction after (A) 20 min and (B) 1 h of reaction and multiple catalyst use. (C) Effect of varying the tin loading from 3.5 to 5.9 wt % on a 5 wt % Ru 2 wt % Pt/C on the conversion of oxalic acid after 1 h and continuous catalysts use in multiple reactions. Reactions were performed in a 100 mL Hastelloy batch reactor, and data was obtained by liquid chromatography (LC). Conditions during reactions: Catalyst were reduced ex situ at 400 °C for 3 h; catalyst loading = 2 g; temperature = 75 °C; pressure = 100 bar H2; substrate = 100 g oxalic acid (10 wt %) in water.
In a second step, we altered the tin content (3.5–7.5% range) on bi- and trimetallic catalysts with 5 wt % Ru and 2 wt % of Pt (details see SI 3.11). Figure C shows the improvement of the Ru–Sn–Pt with varying tin contents over the bimetallic Ru–Sn catalyst without platinum. The most stable and active trimetallic Ru–Sn–Pt catalyst had a tin loading of 4.7 wt % (corresponding to a molar ruthenium–tin ratio of 1:0.85; details see SI 7.14). We show that this Ru1Sn0.85Pt0.2/C catalyst is the most active, selective, and stable catalyst for the reduction of oxalic acid to glycolic acid and allows 100% glycolic acid yield. The structural and electronic changes leading to these improvementsor worsening in the case of other noble metalsrequire further studies and we hereby aim to encourage further research into this catalyst species which are a key step toward green chemicals and polymers.
Conclusions
In conclusion, we successfully synthesized stable, active, and selective catalysts for the reduction of oxalic acid to glycolic acid. The addition of tin suppressed the formation of acetic acid and the over-reduction of glycolic acid to ethylene glycol without reducing the activity of the catalyst notably. While many supports appeared suitable, carbon-supported catalysts were the most active and stable. We established that the ideal ruthenium–tin molar ratio is 1:0.85 and that the absence of chlorides, which can be achieved during catalyst synthesis, is important for catalyst stability. Preparation of catalysts via direct precipitation-deposition led to the formation of interacting ruthenium and tin species but no formation of ruthenium–tin alloys. The resulting catalysts initially showed a high yield but degraded during the first hours of the reaction. We studied the structure and electronic properties of chloride-free ruthenium tin catalysts before and after the reaction and identified insufficient reduction as the main reason for catalyst deactivation. Adding a third noble metal to the catalyst improved the catalyst stability. We added Au, Pd, and Pt as a third metal and found Pt to be the most suitable. Ultimately, we present a highly selective and stable Ru1Sn0.85Pt0.2/C catalyst to produce glycolic acid from oxalic acid with 100% yield (75 °C; 1 h; 100 bar H2 in CSTR) and encourage further research into these catalysts to increase stability and fundamental understanding. Overall, our results show that the direct reduction of oxalic acid to glycolic acid, a crucial step in the conversion of CO2 to valuable chemicals and polymers, can be achieved with a stable catalyst at high selectivity and low temperatures with trimetallic ruthenium–tin–platinum catalysts.
Supplementary Material
Acknowledgments
This project has received funding from the European Union’s Horizon 2020 research and innovation program under grant agreement No 767798. We thank Thierry K. Slot and Maria Ronda Lloret, Pieter Laan, and Ihsan Amin for their contributions to synthesize catalysts following novel concepts. Thierry K. Slot and Maria Ronda Lloret provided MXenes and Ti3(Al0.8Sn0.2)C2 MAX phase materials for this work. Pieter Laan helped with providing the knowledge to prepare the dimeric catalysts. Ihsan Amin provided the knowledge and recipe to prepare the polymeric catalysts. P.O. thanks to the Spanish Ministry of Science, Innovation and Universities (Project MCIU-19-RTI2018-094218-B-I00). P.O. would also like to acknowledge the technical support provided by Scientific and Technical Services of the University of Oviedo and the Advanced Microscopy Laboratory. Funding for Seton Hall University by Liquid Light LLC.
The Supporting Information is available free of charge at https://pubs.acs.org/doi/10.1021/acsomega.4c10268.
Complementary figures with metal analysis, catalyst performance, post use analysis and catalyst activity loss; experimental details for used chemicals and catalyst synthesis; reactor details and general operation procedure for trickle-bed flow reactor, Hastelloy CSTR reactor, batch-type reactor; details on catalyst characterization with XRD, BET, ICP-OES, HRSTEM, XPS, SEM-EDS, TPR, FTIR, NMR, Raman-spectroscopy, GC, LC-MS and TGA; detailed description of product analysis; reaction details and conditions for performance and characterization studies; overview of control experiments trickle-bed reactor and glycolic acid reduction (PDF)
The authors declare no competing financial interest.
References
- Rockström J., Steffen W., Noone K., Persson Å., Chapin F. S. I., Lambin E., Lenton T. M., Scheffer M., Folke C., Schellnhuber H. J., Nykvist B., de Wit C. A., Hughes T., van der Leeuw S., Rodhe H., Sörlin S., Snyder P. K., Costanza R., Svedin U., Falkenmark M., Karlberg L., Corell R. W., Fabry V. J., Hansen J., Walker B., Liverman D., Richardson K., Crutzen P., Foley J.. Planetary Boundaries: Exploring the Safe Operating Space for Humanity. Ecol. Soc. 2009;14(2):32. doi: 10.5751/ES-03180-140232. [DOI] [PubMed] [Google Scholar]
- Levett, C. ; Carrington, D. . The Climate Crisis Explained in 10 Charts; The Guardian, 2019. https://www.theguardian.com/environment/2019/sep/20/the-climate-crisis-explained-in-10-charts (accessed March 03, 2021). [Google Scholar]
- Leonard, A. Our Plastic Pollution Crisis Is Too Big for Recycling to Fix; The Guardian, 2018. https://www.theguardian.com/commentisfree/2018/jun/09/recycling-plastic-crisis-oceans-pollution-corporate-responsibility. [Google Scholar]
- Laville, S. Single-Use Plastics a Serious Climate Change Hazard, Study Warns; The Guardian, 2019. https://www.theguardian.com/environment/2019/may/15/single-use-plastics-a-serious-climate-change-hazard-study-warns. [Google Scholar]
- Otto A., Grube T., Schiebahn S., Stolten D.. Closing the Loop: Captured CO2 as a Feedstock in the Chemical Industry. Energy Environ. Sci. 2015;8(11):3283–3297. doi: 10.1039/C5EE02591E. [DOI] [Google Scholar]
- Aldaco R., Butnar I., Margallo M., Laso J., Rumayor M., Dominguez-Ramos A., Irabien A., Dodds P. E.. Bringing Value to the Chemical Industry from Capture, Storage and Use of CO2: A Dynamic LCA of Formic Acid Production. Sci. Total Environ. 2019;663:738–753. doi: 10.1016/j.scitotenv.2019.01.395. [DOI] [PubMed] [Google Scholar]
- Levi P. G., Cullen J. M.. Mapping Global Flows of Chemicals: From Fossil Fuel Feedstocks to Chemical Products. Environ. Sci. Technol. 2018;52(4):1725–1734. doi: 10.1021/acs.est.7b04573. [DOI] [PubMed] [Google Scholar]
- Kätelhön A., Meys R., Deutz S., Suh S., Bardow A.. Climate Change Mitigation Potential of Carbon Capture and Utilization in the Chemical Industry. Proc. Natl. Acad. Sci. U.S.A. 2019;116(23):11187–11194. doi: 10.1073/pnas.1821029116. [DOI] [PMC free article] [PubMed] [Google Scholar]
- Anastas P., Eghbali N.. Green Chemistry: Principles and Practice. Chem. Soc. Rev. 2010;39(1):301–312. doi: 10.1039/B918763B. [DOI] [PubMed] [Google Scholar]
- Murcia Valderrama M. A., van Putten R.-J., Gruter G.-J. M.. The Potential of Oxalic – and Glycolic Acid Based Polyesters (Review). Towards CO2 as a Feedstock (Carbon Capture and Utilization – CCU) Eur. Polym. J. 2019;119:445–468. doi: 10.1016/j.eurpolymj.2019.07.036. [DOI] [Google Scholar]
- Schuler E., Grooten L., Kasireddy M., More S., Shiju N. R., Tanielyan S. K., Augustine R. L., Gruter G.-J. M.. Oxalic Acid Hydrogenation to Glycolic Acid: Heterogeneous Catalysts Screening. Green Chem. 2023;25(6):2409–2426. doi: 10.1039/D2GC02411J. [DOI] [Google Scholar]
- Murcia Valderrama M. A., van Putten R.-J., Gruter G.-J. M.. PLGA Barrier Materials from CO2. The Influence of Lactide Co-Monomer on Glycolic Acid Polyesters. ACS Appl. Polym. Mater. 2020;2(7):2706–2718. doi: 10.1021/acsapm.0c00315. [DOI] [PMC free article] [PubMed] [Google Scholar]
- Schuler E., Stoop M., Shiju N. R., Gruter G.-J. M.. Stepping Stones in CO 2 Utilization: Optimizing the Formate to Oxalate Coupling Reaction Using Response Surface Modeling. ACS Sustainable Chem. Eng. 2021;9(44):14777–14788. doi: 10.1021/acssuschemeng.1c04539. [DOI] [PMC free article] [PubMed] [Google Scholar]
- Oxalic Acid from CO2 Using Eletrochemistry At DemonstratioN Scale | OCEAN Project | H2020 | CORDIS | European Commission, 2020. https://cordis.europa.eu/project/id/767798 (accessed Feb 04, 2020).
- Philips M. F., Gruter G. J. M., Koper M. T. M., Schouten K. J. P.. Optimizing the Electrochemical Reduction of CO2 to Formate: A State-of-the-Art Analysis. ACS Sustainable Chem. Eng. 2020;8(41):15430–15444. doi: 10.1021/acssuschemeng.0c05215. [DOI] [Google Scholar]
- Pavesi D., Ali F. S. M., Anastasiadou D., Kallio T., Figueiredo M., Gruter G. J. M., Koper M. T. M., Schouten K. J. P.. CO2 electroreduction on Bimetallic Pd-In Nanoparticles. Catal. Sci. Technol. 2020;10(13):4264–4270. doi: 10.1039/D0CY00831A. [DOI] [Google Scholar]
- Schuler E., Morana M., Ermolich P. A., Lüschen K., Greer A. J., Taylor S. F. R., Hardacre C., Shiju N. R., Gruter G.-J. M.. Formate as a Key Intermediate in CO2 Utilization. Green Chem. 2022;24(21):8227–8258. doi: 10.1039/D2GC02220F. [DOI] [Google Scholar]
- Transparency Market Research . Glycolic Acid MarketGlobal Industry Analysis, Size, Share, Growth, Trends, and Forecast, 2019–2027, 2019. https://www.researchandmarkets.com/reports/5005230/glycolic-acid-market-global-industry-analysis#rela1-4897437.
- Kurniawan, A. F. ; Ma’rufi, I. ; Sujoso, A. D. P. . Hydroxycarboxylic Acids, Aliphatic. Ullmann’s Encyclopedia of Industrial Chemistry; John Wiley & Sons, Inc., 2012; Vol. 18, pp 481–492. [Google Scholar]
- Loder, D. J. Process for Manufacture of Glycolic Acid. US2152852, 1939.
- Zhao D., Zhu T., Li J., Cui L., Zhang Z., Zhuang X., Ding J.. Poly(Lactic-Co-Glycolic Acid)-Based Composite Bone-Substitute Materials. Bioact. Mater. 2021;6(2):346–360. doi: 10.1016/j.bioactmat.2020.08.016. [DOI] [PMC free article] [PubMed] [Google Scholar]
- Yunhai S., Houyong S., Haiyong C., Deming L., Qinghua L.. Synergistic Extraction of Glycolic Acid from Glycolonitrile Hydrolysate. Ind. Eng. Chem. Res. 2011;50(13):8216–8224. doi: 10.1021/ie200445n. [DOI] [Google Scholar]
- Yu B.-Y., Chung C.-Y., Chien I.-L.. Development of a Plant-Wide Dimethyl Oxalate (DMO) Synthesis Process from Syngas: Rigorous Design and Optimization. Comput. Chem. Eng. 2018;119:85–100. doi: 10.1016/j.compchemeng.2018.08.025. [DOI] [Google Scholar]
- Göktürk E., Pemba A. G., Miller S. A.. Polyglycolic Acid from the Direct Polymerization of Renewable C1 Feedstocks. Polym. Chem. 2015;6(21):3918–3925. doi: 10.1039/C5PY00230C. [DOI] [Google Scholar]
- Samantaray P. K., Little A., Haddleton D. M., McNally T., Tan B., Sun Z., Huang W., Ji Y., Wan C.. Poly(Glycolic Acid) (PGA): A Versatile Building Block Expanding High Performance and Sustainable Bioplastic Applications. Green Chem. 2020;22(13):4055–4081. doi: 10.1039/D0GC01394C. [DOI] [Google Scholar]
- Zhou X., Zha M., Cao J., Yan H., Feng X., Chen D., Yang C.. Glycolic Acid Production from Ethylene Glycol via Sustainable Biomass Energy: Integrated Conceptual Process Design and Comparative Techno-Economic–Society–Environment Analysis. ACS Sustainabe Chem. Eng. 2021;9(32):10948–10962. doi: 10.1021/acssuschemeng.1c03717. [DOI] [Google Scholar]
- Madduluri V. R., Lim M. Y., Saud A. S., Maniam G. P., Ab Rahim M. H.. Direct Valorization of Cellulose and Glucose to Glycolic Acid through Green Catalytic Process. Catal. Lett. 2024;154(3):994–1006. doi: 10.1007/s10562-023-04360-9. [DOI] [Google Scholar]
- Li S., Deng W., Wang S., Wang P., An D., Li Y., Zhang Q., Wang Y.. Catalytic Transformation of Cellulose and Its Derivatives into Functionalized Organic Acids. ChemSusChem. 2018;11(13):1995–2028. doi: 10.1002/cssc.201800440. [DOI] [PubMed] [Google Scholar]
- Rosenboom J. G., Langer R., Traverso G.. Bioplastics for a Circular Economy. Nat. Rev. Mater. 2022;7(2):117–137. doi: 10.1038/s41578-021-00407-8. [DOI] [PMC free article] [PubMed] [Google Scholar]
- Escobar N., Britz W.. Metrics on the Sustainability of Region-Specific Bioplastics Production, Considering Global Land Use Change Effects. Resour., Conserv. Recycl. 2021;167:105345. doi: 10.1016/j.resconrec.2020.105345. [DOI] [Google Scholar]
- Santos J. H. S., Gomes J. T. S., Benachour M., Medeiros E. B. M., Abreu C. A. M., Lima-Filho N. M.. Selective Hydrogenation of Oxalic Acid to Glycolic Acid and Ethylene Glycol with a Ruthenium Catalyst. React. Kinet., Mech. Catal. 2020;131(1):139–151. doi: 10.1007/s11144-020-01843-3. [DOI] [Google Scholar]
- Lange, J. P. ; Meurs, J. ; Rigutto, M. ; Stil, H. . A Method of Preparing Glycolic Acid. EP16154238, 2016.
- Slot T. K., Oulego P., Sofer Z., Bai Y., Rothenberg G., Raveendran Shiju N.. Ruthenium on Alkali-Exfoliated Ti3(Al0.8Sn0.2)C2MAX Phase Catalyses Reduction of 4-Nitroaniline with Ammonia Borane. ChemCatChem. 2021;13(15):3470–3478. doi: 10.1002/cctc.202100158. [DOI] [Google Scholar]
- Hernandez-Mejia C., Gnanakumar E. S., Olivos-Suarez A., Gascon J., Greer H. F., Zhou W., Rothenberg G., Raveendran Shiju N.. Ru/TiO2-Catalysed Hydrogenation of Xylose: The Role of the Crystal Structure of the Support. Catal. Sci. Technol. 2016;6(2):577–582. doi: 10.1039/C5CY01005E. [DOI] [Google Scholar]
- Akiyama S., Kakio T., Indou S., Oikawa R., Ugou K., Hiraki R., Sano M., Suzuki T., Miyake T.. Preparation of Ru-Sn/C Catalysts and Their Performance in Hydrogenation of Lactic Acid. J. Jpn. Pet. Inst. 2014;57(5):216–224. doi: 10.1627/jpi.57.216. [DOI] [Google Scholar]
- Carnahan J. E., Ford T. A., Gresham W. F., Grigsby W. E., Hager G. F.. Ruthenium-Catalyzed Hydrogenation of Acids to Alcohols. J. Am. Chem. Soc. 1955;77:3766. doi: 10.1021/ja01619a025. [DOI] [Google Scholar]
- Pang J., Zheng M., Li X., Jiang Y., Zhao Y., Wang A., Wang J., Wang X., Zhang T.. Selective Conversion of Concentrated Glucose to 1,2-Propylene Glycol and Ethylene Glycol by Using RuSn/AC Catalysts. Appl. Catal., B. 2018;239:300–308. doi: 10.1016/j.apcatb.2018.08.022. [DOI] [Google Scholar]
- Sánchez M. A., Mazzieri V. A., Pronier S., Vicerich M. A., Especel C., Epron F., Pieck C. L.. Ru-Sn-B/TiO 2 Catalysts for Methyl Oleate Selective Hydrogenation. Influence of the Preparation Method and the Chlorine Content. J. Chem. Technol. Biotechnol. 2019;94(3):982–991. doi: 10.1002/jctb.5849. [DOI] [Google Scholar]
- Deshpande V. M., Ramnarayan K., Narasimhan C. S.. Studies on Ruthenium-Tin Boride Catalysts II. Hydrogenation of Fatty Acid Esters to Fatty Alcohols. J. Catal. 1990;121(1):174–182. doi: 10.1016/0021-9517(90)90227-B. [DOI] [Google Scholar]
- dos Santos S. M., Silva A. M., Jordão E., Fraga M. A.. Performance of RuSn Catalysts Supported on Different Oxides in the Selective Hydrogenation of Dimethyl Adipate. Catal. Today. 2005;107–108:250–257. doi: 10.1016/j.cattod.2005.07.076. [DOI] [Google Scholar]
- Silva, A. M. ; Santos, O. A. A. ; Morales, M. A. ; Baggio-Saitovitch, E. M. ; Jordão, E. ; Fraga, M. A. . Role of Catalyst Preparation on Determining Selective Sites for Hydrogenation of Dimethyl Adipate over RuSn/Al2O3. J. Mol. Catal. A: Chem. 2006. 253 62 10.1016/j.molcata.2006.03.005. [DOI] [Google Scholar]
- Silva A. M., Santos O. A. A., Mendes M. J., Jordão E., Fraga M. A.. Hydrogenation of Citral over Ruthenium-Tin Catalysts. Appl. Catal., A. 2003;241:155. doi: 10.1016/S0926-860X(02)00463-5. [DOI] [Google Scholar]
- Guo J., Zhang W., Zhang L., Chen D., Zhan J., Wang X., Shiju N. R., Yu F.. Control over Electrochemical CO 2 Reduction Selectivity by Coordination Engineering of Tin Single-Atom Catalysts. Adv. Sci. 2021;8(23):2102884. doi: 10.1002/advs.202102884. [DOI] [PMC free article] [PubMed] [Google Scholar]
- Tamura M., Nakagawa Y., Tomishige K.. Recent Developments of Heterogeneous Catalysts for Hydrogenation of Carboxylic Acids to Their Corresponding Alcohols. Asian J. Org. Chem. 2020;9(2):126–143. doi: 10.1002/ajoc.201900667. [DOI] [Google Scholar]
- Toba M., Tanaka S. I., Niwa S. I., Mizukami F., Koppány Z., Guczi L., Cheah K. Y., Tang T. S.. Synthesis of Alcohols and Diols by Hydrogenation of Carboxylic Acids and Esters over Ru-Sn-Al2O3 Catalysts. Appl. Catal., A. 1999;189:243. doi: 10.1016/S0926-860X(99)00281-1. [DOI] [Google Scholar]
- Galvagno S., Donato A., Neri G., Pietropaolo R.. Hydrogenation of CC and CO Groups on Ruthenium-Tin Catalysts. Catal. Lett. 1991;8(1):9–14. doi: 10.1007/BF00764377. [DOI] [Google Scholar]
- Pouilloux Y., Autin F., Guimon C., Barrault J.. Hydrogenation of Fatty Esters over Ruthenium–Tin Catalysts; Characterization and Identification of Active Centers. J. Catal. 1998;176:215. doi: 10.1006/jcat.1998.2044. [DOI] [Google Scholar]
- Luo Z., Bing Q., Kong J., Liu J. Y., Zhao C.. Mechanism of Supported Ru3Sn7 Nanocluster-Catalyzed Selective Hydrogenation of Coconut Oil to Fatty Alcohols. Catal. Sci. Technol. 2018;8(5):1322–1332. doi: 10.1039/C8CY00037A. [DOI] [Google Scholar]
- BatchingtonCatalysis Avantium, 2021. https://www.catalysis.avantium.com/batchington/ (accessed Dec 29, 2021).
- Schuler E., Grooten L., Oulego P., Shiju N. R., Gruter G.-J. M.. Selective Reduction of Oxalic Acid to Glycolic Acid at Low Temperature in a Continuous Flow Process. RSC Sustainability. 2023;1(8):2072–2080. doi: 10.1039/D3SU00185G. [DOI] [Google Scholar]
- Narita T., Miura H., Ohira M., Hondou H., Sugiyama K., Matsuda T., Gonzalez R. D.. The Effect of Reduction Temperature on the Chemisorptive Properties of Ru/Al2O3: Effect of Chlorine. Appl. Catal. 1987;32:185–190. doi: 10.1016/S0166-9834(00)80624-7. [DOI] [Google Scholar]
- Nakamura T., Ohshima M.-A., Kurokawa H., Miura H.. Effects of Removing Residual Chlorine on the Hydrogenation of Aromatic Hydrocarbons over Supported Ru Catalysts. Chem. Lett. 2010;39(1):62–63. doi: 10.1246/cl.2010.62. [DOI] [Google Scholar]
- Shiflett W. K., Dumesic J. A.. Ammonia Synthesis as a Catalytic Probe of Supported Ruthenium Catalysts: The Role of the Support and the Effect of Chlorine. Ind. Eng. Chem. Fundam. 1981;20(3):246–250. doi: 10.1021/i100003a011. [DOI] [Google Scholar]
- Narita T., Miura H., Sugiyama K., Matsuda T., Gonzalez R. D.. The Effect of Reduction Temperature on the Chemisorptive Properties of RuSiO2: Effect of Chlorine. J. Catal. 1987;103(2):492–495. doi: 10.1016/0021-9517(87)90140-0. [DOI] [Google Scholar]
- Mazzieri V. A., Sad M. R., Vera C. R., Pieck C. L., Grau R.. Preparation and Characterization oF Ru-Sn/Al2O3 Catalysts for the Hydrogenation of Fatty Acid Methyl Esters. Quim. Nova. 2010;33(2):269–272. doi: 10.1590/S0100-40422010000200007. [DOI] [Google Scholar]
- Mazzieri V., Coloma-Pascual F., Arcoya A., L’Argentière P. C., Fígoli N. S.. XPS, FTIR and TPR Characterization of Ru/Al 2 O 3 Catalysts. Appl. Surf. Sci. 2003;210(3–4):222–230. doi: 10.1016/S0169-4332(03)00146-6. [DOI] [Google Scholar]
- Vardon D. R., Settle A. E., Vorotnikov V., Menart M. J., Eaton T. R., Unocic K. A., Steirer K. X., Wood K. N., Cleveland N. S., Moyer K. E., Michener W. E., Beckham G. T.. Ru-Sn/AC for the Aqueous-Phase Reduction of Succinic Acid to 1,4-Butanediol under Continuous Process Conditions. ACS Catal. 2017;7:6207. doi: 10.1021/acscatal.7b02015. [DOI] [Google Scholar]
- Lesiak B., Kövér L., Tóth J., Zemek J., Jiricek P., Kromka A., Rangam N.. C Sp2/Sp3 Hybridisations in Carbon Nanomaterials – XPS and (X)AES Study. Appl. Surf. Sci. 2018;452:223–231. doi: 10.1016/j.apsusc.2018.04.269. [DOI] [Google Scholar]
- Fulvio P. F., Mayes R. T., Bauer J. C., Wang X., Mahurin S. M., Veith G. M., Dai S.. One-Pot” Synthesis of Phosphorylated Mesoporous Carbon Heterogeneous Catalysts with Tailored Surface Acidity. Catal. Today. 2012;186(1):12–19. doi: 10.1016/j.cattod.2011.08.004. [DOI] [Google Scholar]
- Cattaneo S., Stucchi M., Veith G. M., Prati L., Wang D., Wang W., Villa A.. Ru Supported on Micro and Mesoporous Carbons as Catalysts for Biomass-Derived Molecules Hydrogenation. Catal. Today. 2020;357:143–151. doi: 10.1016/j.cattod.2019.05.009. [DOI] [Google Scholar]
- Nowitzki T., Carlsson A. F., Martyanov O., Naschitzki M., Zielasek V., Risse T., Schmal M., Freund H.-J., Bäumer M.. Oxidation of Alumina-Supported Co and Co–Pd Model Catalysts for the Fischer–Tropsch Reaction. J. Phys. Chem. C. 2007;111(24):8566–8572. doi: 10.1021/jp066796r. [DOI] [Google Scholar]
- Jacobs G., Patterson P. M., Zhang Y., Das T., Li J., Davis B. H.. Fischer–Tropsch Synthesis: Deactivation of Noble Metal-Promoted Co/Al2O3 Catalysts. Appl. Catal., A. 2002;233(1–2):215–226. doi: 10.1016/S0926-860X(02)00147-3. [DOI] [Google Scholar]
- Viljoen E. L., van Steen E.. Rate of Oxidation of a Cobalt Catalyst in Water and Water/Hydrogen Mixtures: Influence of Platinum as a Reduction Promoter. Catal. Lett. 2009;133(1–2):8–13. doi: 10.1007/s10562-009-0169-7. [DOI] [Google Scholar]
Associated Data
This section collects any data citations, data availability statements, or supplementary materials included in this article.