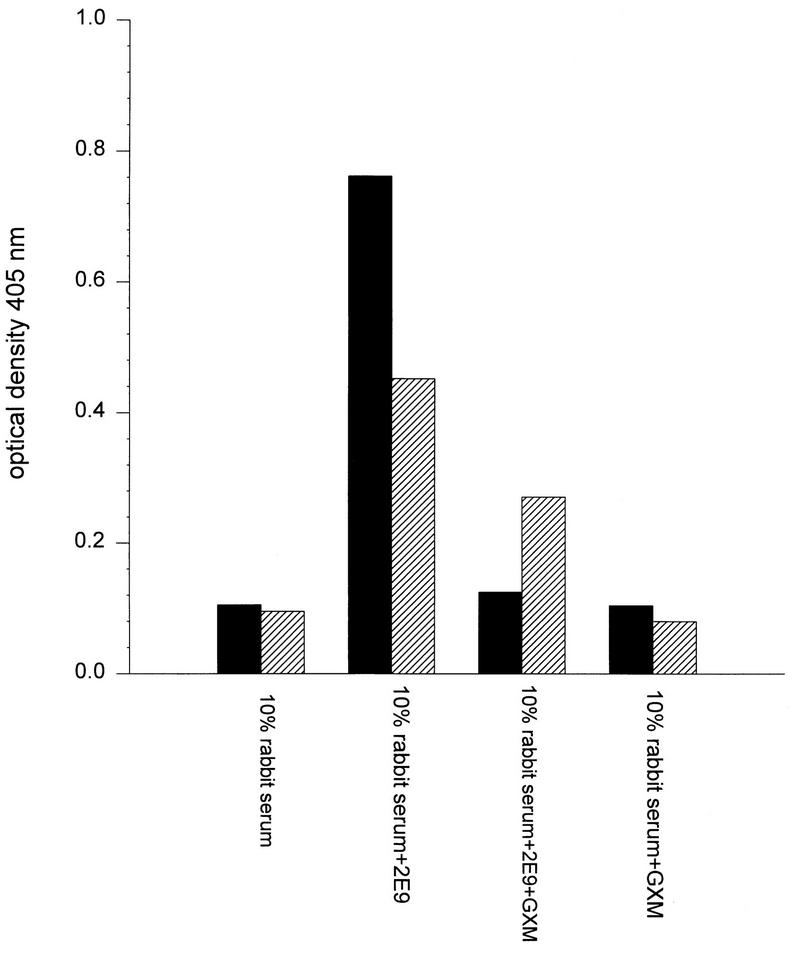
FIG. 2.
ELISA determination of 2E9 complement activation and C3 deposition on GXM and φ13. C3 deposition is represented by the absorbance at 405 nm of wells that were incubated with goat anti-human C3 as described in the text. The OD at 405 nm is depicted on the y axis for each of the opsonins shown on the x axis. Solid bars, absorbances of GXM-coated wells; diagonally striped bars, absorbances of φ13-coated wells. Each bar represents the average of duplicate wells.

