

Abstract
Background:
Gestational diabetes mellitus poses a significant global health concern during pregnancy, with behaviour change interventions offering effective risk reduction.
Objectives:
Understanding diverse engagement patterns of pregnant women within mobile health (mHealth) interventions is vital for personalised healthcare. Tailoring interventions based on participant engagement types can enhance program effectiveness. This study aimed to explore engagement patterns among pregnant women at risk of gestational diabetes using the Liva app.
Design:
This retrospective study serves as a secondary analysis of a randomised controlled trial, focusing on engagement patterns among participants in the intervention arm who received digital health coaching. The intervention group comprised participants enrolled in the Liva app, receiving mHealth lifestyle coaching. Our analysis concentrated on app usage data from 328 participants within the intervention group during the first phase of the study.
Methods:
Principal component analysis reduced data to two dimensions, revealing principal components (PCs). A Gaussian mixture model clustered participants into distinct engagement patterns.
Results:
Analysis of data from 328 pregnant women using the Liva app identified 3 distinct engagement clusters: Cluster 1, “Averagers”; Cluster 2, “Goalers”; and Cluster 3, “Immersers.” These clusters correlated with two PCs. “Averagers” engaged moderately with both “Coach Features” and “Goal Features.” “Goalers” predominantly used “Goal Features,” while “Immersers” engaged with both “Coach Features” and “Goal Features.” Notably, 82% of participants fell into the “Averagers” category.
Conclusion:
This study reveals that individuals, despite similar program participation under uniform conditions, engage with the program differently. Understanding these differences is essential to provide personalised support during pregnancy and has implications for tailored medicine, digital health, and intervention development. Further research is needed to validate these findings across diverse healthcare settings, exploring engagement patterns throughout different pregnancy phases and their impact on health outcomes.
Keywords: health behaviour, gestational diabetes, pregnancy, pregnant women, mobile applications, cluster analysis, principal component analysis, algorithms, machine learning
Plain language summary
Understanding how pregnant women engage with coaching and intervention via a mobile health app to reduce gestational diabetes risk
Why was the study done? Gestational diabetes is a significant concern during pregnancy, and how pregnant women interact with mobile health interventions can influence their risk. The study aimed to explore how women engage with a digital app called Liva, which offers coaching and support to reduce this risk. Understanding these engagement patterns can help deliver more personalised and effective healthcare.
What did the researchers do? The research team used a method called Principal Component Analysis (PCA) to analyse engagement data from the app. They aimed to identify different patterns of how pregnant women used the app’s features, which include coaching and goal-setting tools.
What did the researchers find? The study identified three main types of engagement among participants: 1. Averagers : These women engaged moderately with both the coaching and goal-setting features of the app. 2. Goalers : This group focused primarily on setting and achieving specific goals in the app. 3. Immersers : These women extensively engaged with both coaching and goal-setting features. Overall, the majority of participants were in the Averagers category.
What do the findings mean? This study highlights the importance of understanding the different ways pregnant women engage with novel digital health interventions, such as the Liva app, instead of simply categorising engagement as high or low. By identifying the distinct engagement types - Averagers, Goalers, and Immersers - we gain valuable insights into how these patterns can affect the effectiveness of behaviour change interventions aimed at reducing gestational diabetes risk. This understanding allows for more personalized care in maternal health, addressing a significant gap in current research on digital health interactions among pregnant women. Ultimately, these findings can inform the design of future digital maternal healthcare practices, leading to improved health outcomes and experiences for pregnant women. Further research will be essential to explore these engagement dynamics in different healthcare contexts and investigate their impact on health outcomes throughout pregnancy.
Introduction
Background
Gestational diabetes mellitus (GDM) is a prevalent health issue characterized by high blood glucose levels resulting from an inability to manage the progressive insulin resistance of pregnancy. 1 It affects approximately 13% of pregnancies worldwide, impacting around 17 million births annually. 2 GDM is a significant risk factor for the development of type 2 diabetes (T2DM), with an estimated 15%–25% of individuals developing it within 1–2 years post-pregnancy and 35%–70% within 10–15 years. 3
Additionally, GDM presents short- and long-term health risks for offspring, including an increased likelihood of being large for gestational age, experiencing shoulder dystocia, having higher infant fat mass, and a greater risk of childhood obesity, thereby establishing a vicious cycle of chronic disease. 3
Health behaviour change interventions, specifically those targeting improvements in diet and physical activity during and after pregnancy, have proven effective in mitigating GDM-related risks by optimizing gestational weight gain. 2
Pregnancy presents a unique window of opportunity for implementing health behaviour change interventions, as women are typically highly motivated during this period. 3 Nevertheless, despite the demonstrated efficacy of such interventions, existing programs are often not designed for widespread implementation and scale-up. The Bump2Baby and Me (B2B&Me) randomised controlled trial (RCT) aims to address these shortcomings by testing an innovative digital health behaviour change intervention for women at risk of GDM throughout pregnancy and the first postpartum year. This intervention is delivered via the Liva app, utilising personalised mobile health (mHealth) coaching. 2 Notably, few studies have explored the impact of mHealth technology on pregnancy and postpartum outcomes. 4 Hence, further research in this area is warranted to investigate the drivers and nuances of participant engagement and their relationship with the mHealth program and its features. The literature commonly categorises participants into highly digitally engaged and minimally engaged groups,5–8 highlighting a correlation between high engagement and improved outcomes.8,9 Therefore, understanding and characterising engagement is essential to ensure successful weight management and, ultimately, the prevention of GDM and T2DM.
Engagement level is not the sole area of interest; the type of engagement is also of potential significance. By classifying engagement types based on app feature utilisation, we can gain deeper insights into what constitutes engagement and identify different patterns associated with it, facilitating a more personalised mHealth program. 8 This approach may also shed light on participants who do not fit into either the highly engaged or minimally engaged categories. This intermediate group holds promise as they represent individuals who could potentially increase their engagement if only their engagement group or cluster could be identified. 10 Consequently, understanding engagement types is crucial for unpacking effective program components, enhancing retention rates, and personalising coaching interventions based on participant preferences and motivation levels.8,11
By categorising mHealth intervention usage into various profiles, future research can delve deeper into the clinical and fidelity outcomes associated with patterns of participant engagement in mHealth delivery techniques. 12 The identification of engagement types and patterns can significantly contribute to enhancing the effectiveness and personalisation of mHealth interventions in the prevention and management of GDM. 8
Objective
The objective of this study is to identify essential program components and distinct engagement types within a mHealth weight-management intervention by employing a cluster analysis. Ultimately, this work aims to customise weight management coaching and programs to align with specific engagement types, potentially leading to improved health behaviour change outcomes.
Method
Overview
Bump2Baby and Me
This study was conducted as part of the B2B&Me RCT detailed in the “Bump2Baby and Me protocol.” 2 In the early stages of pregnancy, 800 women were recruited and screened for eligibility using the validated Monash GDM screening tool. 2 B2B&Me is a 5-year project led by University College Dublin, collaborating with nine partners from five countries. The consortium comprises global experts in maternal and child health, alongside an innovative mHealth technology company; Liva Healthcare. A key outcome of this project is the B2B&Me mHealth Coaching Program, which is an innovative intervention tailored to women at high risk of developing gestational diabetes. The program offers personalised evidence-based guidance on healthy eating and exercise during pregnancy and the first year after birth. The intervention consists of six components:
Synchronous mHealth coaching
Asynchronous mHealth coaching
Automated push notifications
Personalised educational content
Additional support content
Virtual social network
The mHealth coaching intervention is delivered by trained health coaches with healthcare professional backgrounds, including nutrition and dietetics, and experience in maternal and child health. These health coaches drive participant engagement with the app content and customise the behaviour change experience based on individual goals and needs. 2 The coaching communications were based on a predefined structure and a framework grounded on the behavioural change theory taxonomy and the motivational interviewing approach. 13 For a detailed description of each component, see Supplemental Table S1. The mHealth coaching support is delivered digitally through the Liva app. 14 The reporting of this study conforms to the STROBE statement. 15
The Liva app
Table 1 shows a depiction of the app features included in the Liva app. The Liva app is a mHealth application that provides lifestyle behaviour change interventions through health coaches and interactive app features. The listed features are what the participants can interact with within the app. Figure 1 shows screenshots of what the participant will see while navigating the Liva app features.
Table 1.
The Liva app offers 13 distinct variables for user interaction and engagement. These variables, representing content and features, are treated as numerical variables for data analysis and have undergone normalization and conversion for inclusion in PCA and clustering analysis. The resulting units are considered in the comprehensive description provided here.
| Variable list | ||
|---|---|---|
| Name | Description | Unit |
| Time in app | Average number of minutes spent in app per weeks on program. Minutes are a sum of events registered in the app assuming that each event takes 30 s. | Avg min/week |
| Registration frequency | Average number of days between each goal registration. | Days/count/week |
| Number of registrations | Total number of registrations per weeks on program. | Count/week |
| Number of goal types | Total number of distinct goal types set during program. | Count |
| Messages received | Average number of messages received from coach per weeks on program. | Avg messages/week |
| Messages sent | Average number of messages sent to coach per weeks on program. | Avg messages/week |
| Messages read | Average number of messages read out of the number of messages received from coach. | Avg messages/week |
| Message length | Average length of messages sent to coach during program. | Avg characters/message |
| Message seen time | Average number of days between receiving and seeing/opening a message received from the coach. | Avg days/message/week |
| Number of interventions | Number of total interventions out of the number of expected interventions as according to program setup. | Interventions/expected |
| Intervention frequency | Average number of days in between interventions. The interventions should follow the scheduled plan but due to the possibility of rescheduling they might differ. | Avg days/intervention |
| Learning opened | Average number of times learning pieces have been opened per weeks on program. | Avg count/week |
| Group opened | Average number of times group has been opened per weeks on program. The group feature is a forum where participants can chat and share experiences. | Avg count/week |
PCA: principal component analysis.
Figure 1.

Depiction of what the participant see navigating the Liva app. The first screen shows the health coach booking tool, the middle screen is the personalised health behaviour and goal plan, and the final screen is the goal registration and tracking.
The Liva app’s content and training program for health coaches are based on previous research from several RCTs demonstrating significant weight loss and improvements in various health behaviour outcomes, such as healthier diets and increased physical activity. These studies included participants living with obesity, with or without type 2 diabetes, aged 18−70 years.16–18
Study design and setting
The study design and setting are illustrated in Supplemental Figures S1 and S2. The B2B&Me RCT was conducted from November 2020 to October 2023 and is registered prospectively with the Australian New Zealand Clinical Trials Registry (trial registration number ACTRN126200012409322). This retrospective study serves as a secondary analysis of the RCT, focusing on engagement patterns among participants in the intervention arm who received digital health coaching. The intervention group comprised participants enrolled in the Liva app, receiving mHealth lifestyle coaching. Our analysis concentrated on app usage data from 328 participants within the intervention group during the first phase of the study, which encompassed the first 24 weeks of pregnancy (predominantly the first trimester) up to childbirth. As this is a secondary analysis of the RCT, the sample size was initially powered for the RCT itself. Justification for the sample size can be found in the trial protocol. 2 For the purposes of this analysis, all 328 participants were treated as a single cohort, utilising all available data from the intervention group.
Data sources
Demographic characteristics were collected through a questionnaire and the validated Monash GDM risk scoring questions2,19. Anthropometric measurements, such as maternal height (cm) and weight (kg), were extracted from medical records. The body mass index (BMI, kg/m2) was calculated based on these measurements. The demographics questionnaire as well as the Monash GDM risk calculator questions are provided in Supplemental Table S2. App behaviour and activity measures were collected from participants’ in-app use.
The Liva app is directly connected to the Liva production database, meaning that all app activities are logged and stored in the database. The database contains only anonymous data, in compliance with the General Data Protection Regulations (GDPR).
Data processing
The data processing flowchart is displayed in Supplemental Figure S3. The engagement measure was assessed based on the participants’ utilisation of the in-app features listed in Table 1. Each variable was normalised according to the number of weeks the participant was on the program, and the intervention variables were normalised according to the number of planned interventions.
Statistical analyses
The data analysis was conducted in Python 3 using scikit-learn, a free software machine learning library, 20 as well as the SciPy library, used for scientific and technical computing. 21 The different types of engagement and their critical components were investigated using statistical analysis and machine learning. Specifically, principal component analysis (PCA) was employed to determine the weight of each variable in relation to engagement. Subsequently, a clustering algorithm, Gaussian mixture models (GMMs), was applied to identify potential engagement patterns and group participants into engagement types.
Data validation
The nature and validity of the data was first evaluated by examining the distribution of each variable through histograms (Supplemental Figure S4 (a)–(m)). Any extreme abnormalities or statistical outliers were identified during this process. However, since no significant outliers were detected, the analysis was able to proceed without further adjustments.
Principal component analysis
PCA is a tool for analysing large datasets with a high number of dimensions or features per observation. It enhances data interpretability while preserving the maximum amount of information, allowing for the visualisation of multidimensional data. PCA is a linear transformation tool that reduces the number of dimensions by projecting each data point onto only the first few principal components (PCs) based on the variables accounting for most of the variation and information within the data. 22
GMM clustering
After applying PCA and reducing the data to two dimensions, data could be visualised as a scatter plot between the two PCs. We then sought to identify patterns and groups within the data points. One approach for this is to employ a clustering algorithm. Cluster analysis, or clustering, is the process of grouping a set of objects in such a way that objects within the same group (called a cluster) are more similar to each other than to those in other groups. Several clustering algorithms are available, and one representative method is GMM.
GMM is a distribution-based algorithm used to group the dataset into K clusters. GMM represents data points as a weighted sum of Gaussian distributions. Unlike hard assignments of data points to clusters, in which each data point is associated uniquely with one cluster, GMM makes a soft assignment as the probability of a given data point belonging to a given cluster. 23
Clusters can be defined as objects most likely to belong to the same distribution. GMM employs the expectation-maximisation algorithm to compute the probability of each data point belonging to cluster K. The objective of the GMM algorithm is to find the optimal parameters that maximise the likelihood of the observed data given the mixture of Gaussian distributions. The parameters represent the means and covariances of the Gaussians, defining the shape, orientation, and spread of each cluster and its Gaussian distribution. The mixture weights indicate the relative importance of each Gaussian component in the overall mixture. 24
To determine the optimal number of clusters for GMM, we used the Bayesian information criteria (BIC) and Akaike information criterion (AIC). These statistical criteria help select the best model among a finite set of models, with lower BIC/AIC scores being preferred. 23 The AIC/BIC score represents a trade-off between the number of parameters and how well the models fit. We chose the model with the lowest clusters, unless a more complex model could be proven to be a significantly better fit. To test this, we employed the likelihood-ratio (LR) test, which evaluates the goodness of fit between competing statistical models. 25
Test data
To demonstrate and evaluate the chosen methodology, we utilised self-generated test data designed to control input parameters and assess the method under varying conditions. The test data comprises three normal Gaussian distributions characterised by the probability density function:
where μ denotes the mean, σ represents the standard deviation (SD), and σ2 is the variance. 26 We use Python’s numpy.random.normal which takes the parameters loc as μ and the scale parameter as σ. 27
Figure 2 illustrates how the test data is controlled by a set of parameters. Each distribution was generated with N = 1000 entries to ensure adequate sample sizes for reliable results, focusing solely on the three Gaussian distributions for this phase of experimentation. Two distinct groups, x and y, were created by defining sets of parameters μ x , μ y and σ x , σ y . When the parameters for x and y are identical, both groups merge into one cluster; conversely, differing parameters result in separate clusters. We introduced a fraction, f, to regulate the size of each cluster, with equal sizes achieved when f = 0.5. Additionally, we introduced pμ and pσ to manipulate the distributions’ differences, setting μ y + pμ and σ y• pσ. We then defined a standard configuration and established μ x = μ y = 1 and σ x = σ y = 1 with pμ = 0 and pσ = 1 and f = 0.5, which thus results in identical distributions. By adjusting pμ and pσ, we could effectively create distinct clusters.
Figure 2.
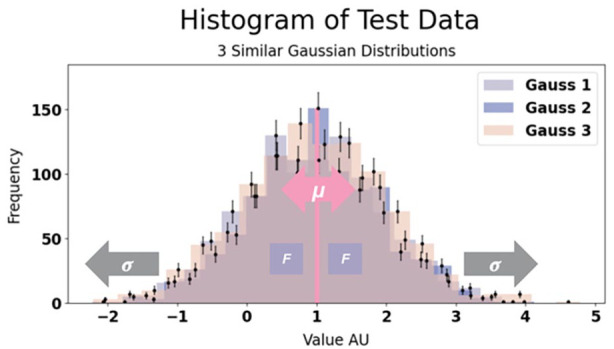
Histogram of our test data consisting of three normal distributions with depiction of how the parameters pμ, marked in pink, and pσ, marked in gray, control our test data and level of similarity between the distributions (and thereby number of clusters). When changing μ the distribution is pulled apart into two groups and when changing σ we change the width of the distribution. Thus, changing these parameters should change the number of clusters in a way that we can predict. When similar, as in this figure, we expect one cluster, but this will be broken up to two clusters when increasing our control parameters. We use this data for testing the optimal clustering algorithm to use for this analysis and to test the validity of our clustering results.
Subsequently, we incorporated a self-generated exponential distribution and a random integer distribution to evaluate the methodology under non-normally distributed conditions. To validate the effectiveness of dimensionality reduction via PCA and clustering using GMMs, we first applied these algorithms to our simulated Gaussian data across various parameter settings, focusing on extreme cases for clearer expectations regarding PCA and GMM behaviour.
To verify that the dimensionality reduction by PCA and clustering with GMM works the way we expect (and want) it to, we first run the algorithm on our self-generated Gaussian data under different settings. We choose the distributions and their parameters such that they represent the “extreme”/“boundary” case of the outcome, making it easier for us to predict the expected behaviour of the PCA and GMM algorithm, respectively.
Supplemental Figure S5 illustrates how PCA maintains the optimal amount of explained variance undergoing dimensionality reduction for single clustered data (Supplemental Figure S5(a)) and separated data (Supplemental Figure S5(b)). Supplemental Figure S5(c) depicts the result of reducing test data from 3D to 2D. We scrutinised PCAs responsiveness under different parameter settings by comparing outcomes for three similar, non-separated distributions against those for separated distributions governed by pμ. Results indicated that PCA correctly preserved the maximum amount of variance during dimensionality reduction, confirming our hypotheses and leading us to select PCA for further analyses due to its simplicity and widespread applicability.
We then examined the GMM clustering algorithm, beginning with a basic configuration of two Gaussian distributions and progressing to a more complex arrangement involving three Gaussian distributions, one exponential, and one random integer distribution. Furthermore, some of the distributions presented in Supplemental Figure S4 illustrated that some data displayed features akin to an exponential distribution, warranting examination of this specific scenario too.
Figure 3 demonstrates that GMM appropriately identified K = 1 for data comprising two similar normal distributions (Figure 3(a)) under standard parameter settings. Further adjustments with pμ revealed K = 2 clusters when the data were separated (Figure 3(b)). Supplemental Figure S6 depicts every clustering result tested and Supplemental Table S3 summarises all parameter configurations tested alongside their respective outcomes.
Figure 3.

Left: Plot of test data histogram. Right: GMM clustering results with number of clusters depicted by the AIC/BIC score. (a) testing for similar distributions under the standard setting which should then provide one single cluster and (b) testing for separated distributions which should thus provide two distinct clusters.
GMM: Gaussian mixture model; AIC: Akaike information criterion; BIC: Bayesian information criteria.
From the data in Supplemental Table S3, it is evident that our clustering approach is effective, with AIC/BIC values aligning with expectations when solely Gaussian distributions are considered (Figure 3 and Supplemental Figure S6(a)–(f)). However, the introduction of exponential and random integer distributions resulted in some instability, as seen in Supplemental Figure S6(g)–(o). Despite not always corresponding with our initial expectations, this discrepancy can be attributed to the increasing uncertainty associated with adding parameters to the test data—a factor that complicates predictive capacity. For instance, with three similar exponential distributions, we observed unexpected results of K = 6 and K = 5, as depicted in Supplemental Figure S6(o).
On the whole, the AIC and BIC metrics generally agreed with our expectations for Gaussian inputs, though AIC tended toward a preference for more complex models with an increased number of clusters, in contrast to BIC.
Figure 4 displays a comparison between a simple clustering task by GMM and K-means clustering, respectively. GMM effectively allocated the expected number of clusters in simpler scenarios, which was paramount to avoid erroneous clustering outcomes. This selection of GMM over more common methods, such as K-means, was informed by its probabilistic assignment capabilities, contrasting with the deterministic nature of K-means. Notably, tests of the K-means algorithm yielded inaccurate results, failing to identify a single cluster even when the input data was homogeneous. The underlying Voronoi iteration of K-means typically leads to suboptimal clustering, 28 as shown in Figure 4. Consequently, GMM was determined to be the superior clustering algorithm for this study, while remaining cognisant of its limitations.
Figure 4.

Left: Plot of test data histogram. Right: Results of GMM versus K-means clustering. K-means clustering with K = 3 as suggested to be the optimal number of clusters by the silhouette score and elbow method. However, our data consist of three very similar Gaussian distributions why we expect only one cluster. Here, the disadvantage of the Voronoi iteration algorithm underlying K-means becomes very clear as we see the equally sized Voronoi cells. Therefore, K-means is not used as the clustering algorithm in this study.
GMM: Gaussian mixture model.
Results
Participant characteristics
Table 2 presents an overview of the baseline demographics of the study participants. The study encompassed 328 pregnant women. The mean age was 35 ± 4.21 years and the mean weight was 75 ± 19.26 kg, with a corresponding mean BMI of 28 ± 6.48 kg/m2, categorising them within the overweight range. The research methodology was systematically applied to the dataset comprising 328 participants and encompassing 13 variables.
Table 2.
Participant baseline demographics.
| Participant baseline demographics | |
|---|---|
| Characteristic | Participants |
| Age (years), mean (SD) | 35.16 (4.21) |
| Weight (kg), mean (SD) | 75.07 (19.26) |
| Height (cm), mean (SD) | 164.47 (6.57) |
| BMI (kg/m2), mean (SD) | 27.67 (6.48) |
| Gravida (count), mean (SD) | 2.43 (1.32) |
| Site distribution, N (%) | |
| Bristol | 94 (28.7) |
| Granada | 88 (26.8) |
| Dublin | 79 (24.1) |
| Melbourne | 67 (20.4) |
| Ethnicity, N (%) | |
| Caucasian | 248 (75.6) |
| Asian/South Asian/South East Asian/Pacific Islander | 50 (15.2) |
| Black/African-American | 18 (5.5) |
| Hispanic/Latino | 9 (2.7) |
| Arabic/Middle Eastern | 2 (0.6) |
| Indigenous Australian/Travelling/Roma/Gypsy Communities | 1 (0.3) |
| Education, N (%) | |
| Graduate/postgraduate education | 146 (44.5) |
| Higher education | 102 (31.1) |
| Post-secondary education | 54 (16.5) |
| Secondary education | 16 (4.9) |
| Unknown | 8 (2.4) |
| Prefer not to answer | 2 (0.6) |
| Employment, N (%) | |
| Employed | 288 (87.8) |
| Not employed | 31 (9.5) |
| Unknown | 8 (2.4) |
| Prefer not to answer | 1 (0.3) |
| Living situation, N (%) | |
| Stable housing | 317 (96.6) |
| Unknown | 8 (2.4) |
| Prefer not to say | 3 (0.9) |
| Marital status, N (%) | |
| Married or have partner | 303 (92.4) |
| Single | 16 (4.9) |
| Divorced | 1 (0.3) |
| Unknown | 8 (2.4) |
| Previous GDM history, N (%) | |
| No | 310 (94.5) |
| Yes | 18 (5.5) |
BMI: body mass index; GDM: gestational diabetes mellitus; SD: standard deviation.
Principal component analysis
Using PCA, we reduced our data to two dimensions. To elucidate the extent of variance captured during dimensionality reduction, we generated a scree plot. The scree plot, presented in Supplemental Figure S7, indicates that approximately 40% of the variance was captured when reducing the data to 2D. Subsequently, with our data transformed into two components, PC-1 and PC-2, we ascertained the variables primarily responsible for each component. This information is graphically depicted in Figure 5.
Figure 5.

Representation of our final PCs and their corresponding variable weights. It illustrates the degree to which each variable is associated with the underlying variance of each PC. The maximum possible correlation is denoted as |1|. Red indicates positive correlation and green indicates negative correlation.
PCs: principal components.
Supplemental Table S4 presents the primary variables that accounted for 35% or more of the variance. Analysis of Supplemental Table S4 reveals that the primary variables for PC-1 include the “Number of interventions,” “Messages sent,” and “Messages read,” all of which exhibited positive correlations with PC-1. In graphical terms, this suggests that participants deviating from the PC-1 axis were more engaged in terms of planned interventions and the exchange of messages with their health coach.
For PC-2, the primary variables are “Time in app,” “Number of registrations,” and “Number of goal types,” all displaying positive correlations. This indicates that participants with high scores on the PC-2 axis spent more time in the app, made more goal registrations, and set a greater number of distinct goals.
Supplemental Table S5 lists the less significant variables, each contributing to less than 30% of the variance for either of the PCs. These variables include “Registration frequency,” “Message length,” “Message seen time,” “Intervention frequency,” “Learning opened,” and “Group opened.”
In summary, instead of considering multiple variables when visually representing the data, we can regard each PC as a thematic grouping of variables, based on its primary contributors. PC-1 primarily encompasses interactions with the health coach and is aptly labeled “Coach engagement.” In contrast, the underlying variables of PC-2 revolve around goal registration, earning it the label “Goal engagement.” Henceforth, we can think of our PCs in terms of these two thematic categories.
Figure 6 provides a visual representation of our reduced data as a scatter plot between PC-1 and PC-2.
Figure 6.
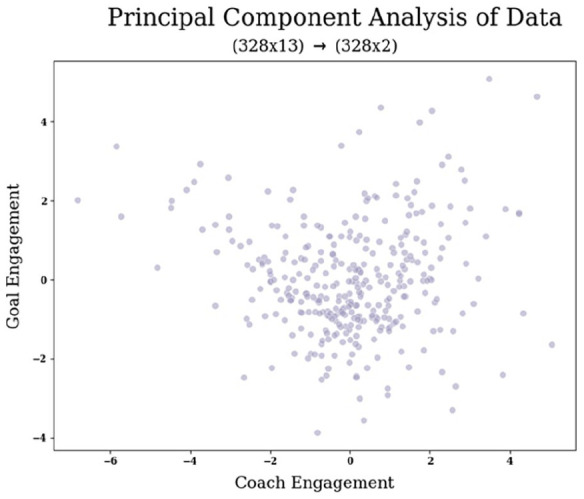
Projection of our data (328 × 13) following PCA dimensionality reduction to two PCs, denoted as “Coach Engagement” and “Goal Engagement.” The scatter plot illustrates the varying degrees of interaction exhibited by each participant with these two thematic components.
PCA: principal component analysis; PC: principal component.
Clustering
With our data dimensionality reduced to 2 through PCA, we proceed to the clustering stage. To determine the optimal number of clusters denoted as “K,” we computed the AIC and BIC scores for various clustering models.
A graphical representation of the best AIC/BIC scores for each model is provided in Supplemental Figure S8. By identifying the models with minimised AIC and BIC scores, we determined the optimal model type and the corresponding number of clusters (K). These results are summarised in Table 3.
Table 3.
Selection of the best model and associated number of clusters (K), based on AIC and BIC, along with their respective scores for the chosen clustering configurations.
| Optimal number of clusters per model | |||
|---|---|---|---|
| Criterion | Score | Model | K clusters |
| AIC | 2385 | Spherical | 6 |
| BIC | 2432 | Tied | 3 |
AIC: Akaike information criterion; BIC: Bayesian information criterion.
Significance between models
As indicated in Table 3, different criteria propose distinct optimal numbers of clusters, with AIC suggesting K = 6 and BIC suggesting K = 3. To make a final determination regarding the number of clusters, we assessed the significance of fit between these suggested clustering options using a LR test. In accordance with Occam’s Razor principle, we always keep the simpler model, unless the more complex model markedly improves the fit, as determined by the LR test.
We performed the LR test by comparing the log-likelihood of the simplest model, which is the null hypothesis denoted as H0 with K = 3, to that of the alternative hypothesis model, referred to as HA, with K = 6. The results of this test are elaborated in Table 4.
Table 4.
A comparison of clustering models using the likelihood-ratio test between our simplest model with K = 3 and the alternative model with K = 6. The more complex model did not offer a significantly better fit, and thus, we retained the null hypothesis and opted for the simpler model with K = 3 clusters.
| LR test | ||||
|---|---|---|---|---|
| H 0 | HA | LR | p-Value | Significant |
| Best BIC | Best AIC | 0.09 | 0.99 | No |
AIC: Akaike information criterion; BIC: Bayesian information criterion; LR: likelihood-ratio.
Principal results
Figure 7 displays the final clustering plot. Based on the results presented in Table 4, the alternative model did not exhibit a significant improvement in fit compared to the simpler model. Consequently, we retained the simpler model, which is of the covariance type full, and used K = 3 clusters in the 2D data representation. We defined the three clusters and extracted the respective cluster characteristics using GMM. Then, each cluster was reshaped into 1D, and we applied a Gaussian distribution fit to obtain parameters such as µ, σ, χ2, and the probability of the fit (p). The 1D plot displaying the Gaussian curves and fits can be seen in Figure 8.
Figure 7.

The final choice of the clustering model based on our AIC/BIC scores and the likelihood-ratio test. The optimal clustering model is the tied model with K = 3 clusters.
AIC: Akaike information criterion; BIC: Bayesian information criterion.
Figure 8.
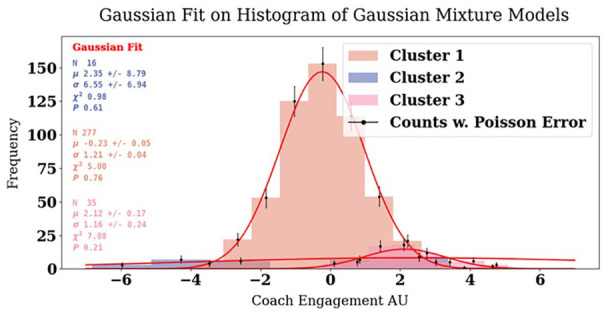
Our final three clusters (shown in Figure 7) reshaped into one dimension and presented as normal distributions and fitted with a Gaussian function.
Summing up the clustering results we ended up with our final clustering choice, depicted in Figure 7, with K = 3 clusters and of model type tied. The BIC score for this model is 2432, with an AIC score of 2390, and a log-likelihood score of −3.6. Based on each cluster’s correlation with the Goal and Coach engagement, we attribute them a representative cluster name.
Cluster 1, which we name “Averagers,” is the most extensive cluster, housing 277 participants, with a Gaussian mixture weight of 82%. Its mean (center) is approximately −0.04 on the x-axis and −0.4 on the y-axis. The assignment probability for participants belonging to cluster 1 is 95%. The fit results yield a µ of −0.23 with a SD of 0.05, σ of 1.21 with an SD of 0.04, a χ2 fit value of 5, and a fit probability of 76%.
Cluster 2, renamed as the “Goalers,” consists of 16 participants, representing 6% of the total. This cluster exhibits a relatively negative mean (center) of −3.8 on the x-axis and a moderately positive mean of 1.7 on the y-axis. The assignment probability for cluster 2 is 87%. The fit results for cluster 2 indicate a µ of 2.35, with SD 8.79, σ of 6.55 with an SD of 6.94, a χ2 fit value of 0.98, and a fit probability of 61%.
Cluster 3, or the “Immersers,” comprises 35 participants, making up 12% of the total. This cluster is characterized by a Gaussian mixture weight of 12% and a mean (center) of 1.9 on the x-axis and 2.1 on the y-axis. The assignment probability for cluster 3 is 86%. The fit results reveal a µ of 2.12, with a SD of 0.17, σ of 1.16 with an SD of 0.24, a χ2 fit value of 7, and a fit probability of 21%.
Discussion
We performed PCA and clustering analysis that characterised engagement patterns of 328 pregnant women at risk of GDM who were using the Liva app. In summary, our results delineate three distinct clusters, each representing a unique engagement type: “Averagers,” “Goalers,” and “Immersers.”
We observed that cluster 1, the “Averagers,” was the most prominent cluster, both in terms of size, spread, and fit. Its mean is centered around zero on both axes. This suggests that participants in this cluster exhibit average interaction levels with the various PCs. Cluster 2, the “Goalers,” was the smallest cluster and had a broader spread and the least convincing Gaussian fit. Participants in this cluster display less interaction with the coach but are relatively more engaged with the goal-related features. Lastly, cluster 3, the “Immersers,” demonstrated positive engagement with both coach and goal-related aspects.
Regarding the engagement types, we discovered that the majority of participants belong to the “Averagers” category. This finding suggests that most participants prefer to follow the program according to the plan during pregnancy without immersing themselves deeply in any specific program feature. This implies that pregnant women may appreciate a more passive approach to engagement, relying on the app’s features and coaching support rather than actively monitoring and managing their progress. It also implies that, to nudge engagement for the majority (“Averagers”), the focus should be on keeping them on track with the program and interacting with the coach, rather than concentrating on engaging with other app features. An analysis of our PCs, Coach Engagement (PC-1) and Goal Engagement (PC-2), in comparison to the less important variables namely Registration Frequency, Message Length, Message Seen Time, Intervention Frequency, Learning Opened, and Group Opened, indicates that while sending and receiving messages to the coach is a primary variable of PC-1, the length of these messages is not a decisive factor for the engagement pattern. Similarly, the time at which the message is seen after it is received is not significant.
While the number of interventions is an underlying factor of PC-1, the frequency does not appear to influence the engagement pattern significantly. This suggests that most participants adhere to the original intervention frequency plan, though some may receive fewer or more interventions than planned, possibly due to rescheduling or canceling synchronous interventions. In the case of PC-2, the number and types of registrations are determining factors, but the frequency of these registrations does not seem to impact the engagement patterns significantly. Lastly, using the learning and group features does not significantly contribute to distinguishing engagement patterns, suggesting a need to reconsider these features or enhance them to cater to participants’ needs more effectively.
Our study suggests that engagement is not a binary high/low concept but can vary by the ways participants engage. Engagement can involve either the Coach and/or Goal features, suggesting that low engagement with Coach features does not necessarily indicate disengagement but rather a preference for engaging with Goal features and vice versa. However, the majority preferred engaging with the coach, reconfirming the importance of a human component and/or coaching element. These insights are important for mHealth developers, designers, and coaches, enabling better and personalised interventions for each participant.
To translate these findings into practice and enhance user engagement with the app, we propose the establishment of personalised engagement profiles for participants during the onboarding process. Through discussions with their coaches, participants can indicate their preferred mode of engagement—whether they prefer to interact primarily with app features and goal-setting tools, to work predominantly with their coach, or to engage with both.
For participants inclined toward self-monitoring their goals, a tailored goals profile would be created, allowing them to focus on personal goal management with less direct coaching involvement. In this model, coaches would still be available to provide support, but their time could be allocated more effectively. This approach would enable coaches to concentrate on those participants who require more assistance, while “Goalers” could manage their own progress with less frequent check-ins.
Conversely, for participants who exhibit engagement levels akin to the “Averagers,” the coaching focus could shift away from goal-setting functionalities in the app, thereby conserving time and resources. In such cases, the coach can redirect their efforts toward strengthening the overall coaching experience and relationship, which is vital for maintaining user engagement. To our knowledge, no literature specifically addresses the comparison of such profiles, why we assert that our study is the first to propose such a framework. This proposes a future study investigating the outcome of such personalised intervention profiles.
Recognising that the frequency of goal registration was less critical than the variety of goals, we could streamline the goal-tracking feature to require fewer entries. This adjustment would accommodate participants’ needs during particularly demanding times, such as pregnancy, by lessening their cognitive load while ensuring they remain oriented toward their objectives.
Furthermore, given the limited usage of the learning and group features in the app, these elements could be reconsidered. One option is to remove such features from the app interface to eliminate potential distractions for participants. Alternatively, if we retain the group functionality, we could explore a more structured approach, such as organising specific online gatherings or collective synchronous coaching sessions. These forums would serve to facilitate the sharing of experiences and support among participants, particularly during shared life events like pregnancy, fostering a sense of community and might even enhance engagement as suggested by a study exploring peer support in the context of women’s mental health treatment experiences during the perinatal period. 29
Overall, by tailoring app features and coaching strategies to align with identified engagement patterns, we can create a more user-centered experience that not only meets participants’ diverse needs but also optimises their interaction with both the app and their coaches.
Comparison with prior work
In comparison to previous studies that utilised clustering algorithms to identify participant engagement groups among pregnant women, our study identified three clusters among the entire sample. In contrast, Morgan et al. 12 found four clusters of outpatient portal use, which were described as “Schedulers,” “Resulters,” “Intense Digital Engagers,” and “Average Users.” Our “Averagers” group, which constitutes 82% of the sample, is most similar to the “Average Users” cluster in Morgan et al.’s study. However, the differences in the number of clusters might be attributed to the different care modalities, engagement variables, and the larger cohort (N = 14,658) in Morgan et al.’s study.
Moreover, a study by Painter et al. 9 and one by Nicol et al. 8 support our findings and underscore the importance of coach interaction and goal-related features. The study by Painter et al. 9 conducted a retrospective study on 2037 participants enrolled in a 12-month digital diabetes prevention program. They performed a subgroup analysis based on participants who were highly engaged versus minimally engaged, defined by specific criteria regarding the number of lessons completed within a certain time frame. They found that highly engaged participants achieved better outcomes in terms of weight loss. Conducting a similar study comparing engagement clusters could provide valuable insights into the correlation between engagement levels and outcomes, expanding the concept to engagement types.
Additionally, the study by Nicol et al. 8 aimed to detect dynamic user needs and preferences for tailoring behavioural interventions for 23 participants using a mHealth treatment over 2 weeks. Their findings align with the results of this study, with the most important components being related to receiving reminders (messages) from the coach and setting and tracking goals. This study also supports the idea that learning and group features are less important variables.
Limitations
The study has some limitations. While GMM was selected as the best fitted clustering algorithm, it may not be ideal for data with mixed distributions, as our data exhibits a mix of normally distributed and exponentially distributed variables. The histogram of our final clusters (Figure 8) shows some overlap and lack of complete separation, suggesting room for improvement in cluster differentiation. The study also captures only 40% of the explained variance during PCA, which means that we considered less than half of the variance when selecting our clustering method. The sample size is relatively small, which may limit the generalisability of the findings.
To address some of the limitations, future research may consider further data reduction methods and alternative clustering algorithms, along with the use of labeled data to use supervised learning through questionnaires to validate clusters. This would make it possible to shift from unsupervised to supervised learning when clustering and having the participants express their preferred mode of support and engagement could pre-indicate the number of K clusters and improve the accuracy of cluster predictions. Additionally, the relationship between cluster groupings and outcomes and input variables should be explored to provide more insights for coaches. Expanding the dataset size may help improve the generalisability and accuracy of the findings.
Nevertheless, we do observe three distinct distributions that somewhat resemble normal curves, indicating that these three groupings are a good preliminary indication of clusters. Additionally, PCA remains our best tool for dimensionality reduction, providing a 40% variation explanation level that offers a representative understanding of data and variable correlations. Despite the relatively small sample size, our study contributes with novel insights into analysing digital health data, particularly in the context of pregnant women. The unique nature of pregnancy introduces potential variations in engagement patterns due to its intensity and ever-changing characteristics.
Conclusion
In conclusion, this research contributes to the understanding of how pregnant women engage with mHealth interventions. It identifies three distinct engagement types and emphasises the importance of the human component (coach) in mHealth programs. These insights have important implications for personalised medicine, digital health, and the development of effective interventions. Further research is necessary to validate and generalise these findings as well as relate cluster grouping to outcome and/or demographic variables. Moreover, additional research is needed across diverse populations and healthcare contexts to gain insights into the evolving dynamics of engagement patterns during pregnancy and postpartum, as well as variations among distinct cohorts. Finally, future research should test and validate the suggested implications and developments in the app based on the findings from this study.
Supplemental Material
Supplemental material, sj-docx-1-whe-10.1177_17455057251327510 for Exploring engagement patterns within a mobile health intervention for women at risk of gestational diabetes by Signe B Bendsen, Timothy C Skinner, Sharleen L O’Reilly, Elena Rey Velasco, Mathias S Heltberg and Ditte H Laursen in Women’s Health
Acknowledgments
We would like to acknowledge the contribution of the members of the IMPACT DIABETES B2B Collaboration Group: Dr. Faisal Zahoor (University College Dublin), Assoc. Prof. Mary Codd (University College Dublin), Assoc. Prof. Jacqueline Boyle (Monash University), Dr. Georgia Soldartis (Monash University), Prof. Alberto Puertas (University of Granada), Dr. Francisca S. Molina (University of Granada), Prof. Enrique Herrera-Viedman (University of Granada). Dr. Mercedes Bermudez (University of Granada), Dr. Nanna Husted Jensen (Aarhus University), Dr. Anna Davies (University of Bristol), Dr. Laura Elina Pirhonen (University of Copenhagen), Assoc. Prof. Ricardo Sigurado (UCD), Prof. Fionnuala McAuliffe (UCD), Prof. Helena Teede, Assoc. Prof. Cheryce Harrison (Monash), Prof. Helle Terkildsen Maindal (Aarhus), Assoc. Prof. Rachel Laws, Pro.f Karen Campbell, Assoc. Prof. Vincent Versace (Deakin), Prof. Karsten Vrangbæk (Copenhagen), Prof. Cristina Campoy and Dr. Mercedes (Granada), Assoc. Prof. Christy Burden (Bristol), Asger Anker Elnegaard (Liva Healthcare), Ryan Moreau (Liva Healthcare), and Stig Jørgensen (Liva Healthcare).
Authors’ Note: Ditte H Laursen is also now affiliated to Department of Clinical and Research, Liva Healthcare A/S, Copenhagen, Denmark.
ORCID iDs: Signe B Bendsen  https://orcid.org/0009-0006-3301-2165
Sharleen L O’Reilly
https://orcid.org/0000-0003-3547-6634
Elena Rey Velasco
https://orcid.org/0000-0003-1337-6085
Ditte H Laursen
https://orcid.org/0000-0001-7011-9996
Supplemental material: Supplemental material for this article is available online.
Declarations
Ethical approval and consent to participate: Ethical approval has been granted for all study sites (Dublin: National Maternity Hospital Ethics Committee ref EC18.2020; Bristol: Wales Research Ethics Committee ref 21/WA/0022; Granada: CEIM/CEI Provincial de Granada; Melbourne: Monash Health Human Research Ethics Committee ref RES-20-0000-892A). There were no particular risks involved in taking part in this trial; however, any events during or after the trial were recorded and reported to the clinical trials manager and site lead. Any protocol amendments after approval by the ethics committees and steering committee were communicated by the project manager to the relevant parties (including site leads, investigators, trial registries, regulators). Informed, written consent was obtained from all participants involved in the study. Prior to enrollment, all participants received information about the study including information on potential risks and benefits and data protection procedures.
Consent for publication: Not applicable.
Author contributions: Signe B Bendsen: Conceptualisation; Data curation; Formal analysis; Investigation; Methodology; Project administration; Visualisation; Writing – original draft; Writing – review & editing.
Timothy C Skinner: Conceptualisation; Formal analysis; Methodology; Project administration; Supervision; Writing – review & editing.
Sharleen L O’Reilly: Conceptualisation; Formal analysis; Funding acquisition; Methodology; Project administration; Supervision; Writing – review & editing.
Elena Rey Velasco: Formal analysis; Supervision; Writing – review & editing.
Mathias S Heltberg: Formal analysis; Methodology; Supervision; Validation; Writing – review & editing.
Ditte H Laursen: Conceptualisation; Formal analysis; Methodology; Project administration; Supervision; Validation; Writing – review & editing.
Funding: The authors disclosed receipt of the following financial support for the research, authorship, and/or publication of this article: The Bump 2 Baby and Me project is funded by the European Union Commission Horizon 2020 grant entitled “Implementation Action to Prevent Diabetes From Bump 2 Baby (IMPACT DIABETES B2B)” under grant agreement 847984, with collaborative National Health and Medical Research Council, Australia co-funding under grant number APP1194234. The project is sponsored by the University College Dublin. The funders and the sponsor have no role in the design of the study; the collection, analysis, and interpretation of the data; or writing of the manuscript or decision to publish. Financial audits are carried out by the European Union Commission. Trial Steering Committee: The committee is comprised of individuals with expertise in implementation, health economics, maternal and child health, and clinical trials. The steering committee is responsible for providing expert oversight of the trial and to monitor the overall progress and conduct of the trial.
Competing interests: The authors declared the following potential conflicts of interest with respect to the research, authorship, and/or publication of this article: DHL is employed at LIVA Healthcare A/S. However, DHL primarily contributed information about the use of the LIVA app in practice and did not influence the results and data analysis.
Data availability: The datasets generated and analysed during the current study are not publicly available due to restrictions on privacy but are available from the corresponding author on reasonable request.
References
- 1. NHS. Overview: gestational diabetes, https://www.nhs.uk/conditions/gestational-diabetes/ (2022, accessed October 3 2024).
- 2. O’Reilly SL, Burden C, Campoy C, et al. Bump2Baby and Me: protocol for a randomised trial of mHealth coaching for healthy gestational weight gain and improved postnatal outcomes in high-risk women and their children. Trials 2021; 22: 963. [DOI] [PMC free article] [PubMed] [Google Scholar]
- 3. Phelan S, Jelalian E, Coustan D, et al. Protocol for a randomized controlled trial of pre-pregnancy lifestyle intervention to reduce recurrence of gestational diabetes: Gestational Diabetes Prevention/Prevención de la Diabetes Gestacional. Trials 2021; 22(1): 256. [DOI] [PMC free article] [PubMed] [Google Scholar]
- 4. Kennelly MA, Ainscough K, Lindsay KL, et al. Pregnancy exercise and nutrition with smartphone application support. Obstet Gynecol 2018; 131: 818–826. [DOI] [PubMed] [Google Scholar]
- 5. Signal V, McLeod M, Stanley J, et al. A mobile- and web-based health intervention program for diabetes and Prediabetes Self-management (betame/melon): process evaluation following a randomized controlled trial. J Med Internet Res 2020; 22(12): e19150. [DOI] [PMC free article] [PubMed] [Google Scholar]
- 6. Koot D, Goh PS, Lim RS, et al. A Mobile Lifestyle Management Program (GlycoLeap) for people with type 2 diabetes: single-arm feasibility study. JMIR Mhealth Uhealth 2019; 7(5): e12965. [DOI] [PMC free article] [PubMed] [Google Scholar]
- 7. Hageman PA, Mroz JE, Yoerger MA, et al. User engagement associated with web-intervention features to attain clinically meaningful weight loss and weight maintenance in rural women. J Obes 2019; 2019: 7932750. [DOI] [PMC free article] [PubMed] [Google Scholar]
- 8. Nicol GE, Ricchio AR, Metts CL, et al. A smartphone-based technique to detect dynamic user preferences for tailoring behavioral interventions: observational utility study of ecological daily needs assessment. JMIR Mhealth Uhealth 2020; 8(11): e18609. [DOI] [PMC free article] [PubMed] [Google Scholar]
- 9. Painter SL, Lu W, Schneider J, et al. Drivers of weight loss in a CDC-recognized digital diabetes prevention program. BMJ Open Diabetes Res Care 2020; 8(1): e001132. [DOI] [PMC free article] [PubMed] [Google Scholar]
- 10. Desveaux L, Shaw J, Saragosa M, et al. A mobile app to improve self-management of individuals with type 2 diabetes: qualitative realist evaluation. J Med Internet Res 2018; 20(3): e81. [DOI] [PMC free article] [PubMed] [Google Scholar]
- 11. Koenigsberg MR, Corliss J. Diabetes self-management: facilitating lifestyle change. Am Fam Physician 2017; 96: 362–370. [PubMed] [Google Scholar]
- 12. Morgan E, Schnell P, Singh P, et al. Outpatient portal use among pregnant individuals: cross-sectional, temporal, and cluster analysis of use. Digit Health 2022; 8: 205520762211095. [DOI] [PMC free article] [PubMed] [Google Scholar]
- 13. Velasco ER, Pedersen HS, Skinner T, et al. Analysis of patient cues in asynchronous health interactions: pilot study combining empathy appraisal and systemic functional linguistics. JMIR Form Res 2022; 6(12): e40058. [DOI] [PMC free article] [PubMed] [Google Scholar]
- 14. Project. Bump2Baby and Me, https://bump2babyandme.org/%20project/ (accessed 3 October 2024).
- 15. von Elm E, Altman DG, Egger M, et al. The Strengthening the Reporting of Observational Studies in Epidemiology (STROBE) statement: guidelines for reporting observational studies. Ann Intern Med 2007; 147: 573–577. [DOI] [PubMed] [Google Scholar]
- 16. Christensen JR, Laursen DH, Lauridsen JT, et al. Reversing type 2 diabetes in a primary care-anchored Ehealth lifestyle coaching programme in Denmark: a randomised controlled trial. Nutrients 2022; 14: 3424. [DOI] [PMC free article] [PubMed] [Google Scholar]
- 17. Christensen JR, Hesseldal L, Olesen TB, et al. Long-term weight loss in a 24-month primary care-anchored telehealth lifestyle coaching program: randomized controlled trial. J Telemed Telecare 2022; 28: 764–770. [DOI] [PubMed] [Google Scholar]
- 18. Komkova A, Brandt CJ, Hansen Pedersen D, et al. Electronic health lifestyle coaching among diabetes patients in a real-life municipality setting: observational study. JMIR Diabetes 2019; 4(1): e12140. [DOI] [PMC free article] [PubMed] [Google Scholar]
- 19. Teede HJ, Harrison CL, Teh WT, et al. Gestational diabetes: development of an early risk prediction tool to facilitate opportunities for prevention. Aust N Z J Obstet Gynaecol 2011; 51: 499–504. [DOI] [PubMed] [Google Scholar]
- 20. Scikit-Learn. Wikipedia, https://en.wikipedia.org/wiki/%20Scikit-learn (2024, accessed 3 October 2024).
- 21. SciPy. Wikipedia, https://en.wikipedia.org/wiki/%20SciPy (2024, accessed October 3 2024).
- 22. Principal component analysis. Wikipedia, https://en.wikipedia.org/wiki/%20Principal_component_analysis (2024, accessed October 3 2024).
- 23. Duchesnay E. Clustering. Clustering—Statistics and Machine Learning in Python 0.5 documentation, https://duchesnay.github.io/pystatsml/machine_learning/clustering.html (2020, accessed 3 October 2024).
- 24. CronJ. Gaussian Mixture Model in Image Processing Explained, https://www.cronj.com/blog/gaussian-mixture-model-in-image-processing-explained/ (accessed 3 October 2024).
- 25. Bobbitt Z. How to Perform a Likelihood Ratio Test in Python. Statology, https://www.statology.org/likelihood-ratio-test-in-python/ (2021, accessed 3 October 2024).
- 26. Normal distribution. Wikipedia, https://en.wikipedia.org/wiki/Normal_distribution (2024, accessed 3 October 2024).
- 27. Numpy.random.normal. NumPy v2.2 Manual, https://numpy.org/doc/stable/reference/random/generated/numpy.random.normal.html (accessed 3 October 2024).
- 28. K-means clustering. Wikipedia, https://en.wikipedia.org/wiki/K-means_clustering (2024, accessed October 3 2024).
- 29. Rice C, Ingram E, O’Mahen H. A qualitative study of the impact of peer support on women’s mental health treatment experiences during the perinatal period. BMC Pregnancy Childbirth 2022; 22(1): 689. [DOI] [PMC free article] [PubMed] [Google Scholar]
Associated Data
This section collects any data citations, data availability statements, or supplementary materials included in this article.
Supplementary Materials
Supplemental material, sj-docx-1-whe-10.1177_17455057251327510 for Exploring engagement patterns within a mobile health intervention for women at risk of gestational diabetes by Signe B Bendsen, Timothy C Skinner, Sharleen L O’Reilly, Elena Rey Velasco, Mathias S Heltberg and Ditte H Laursen in Women’s Health