FIG. 6.
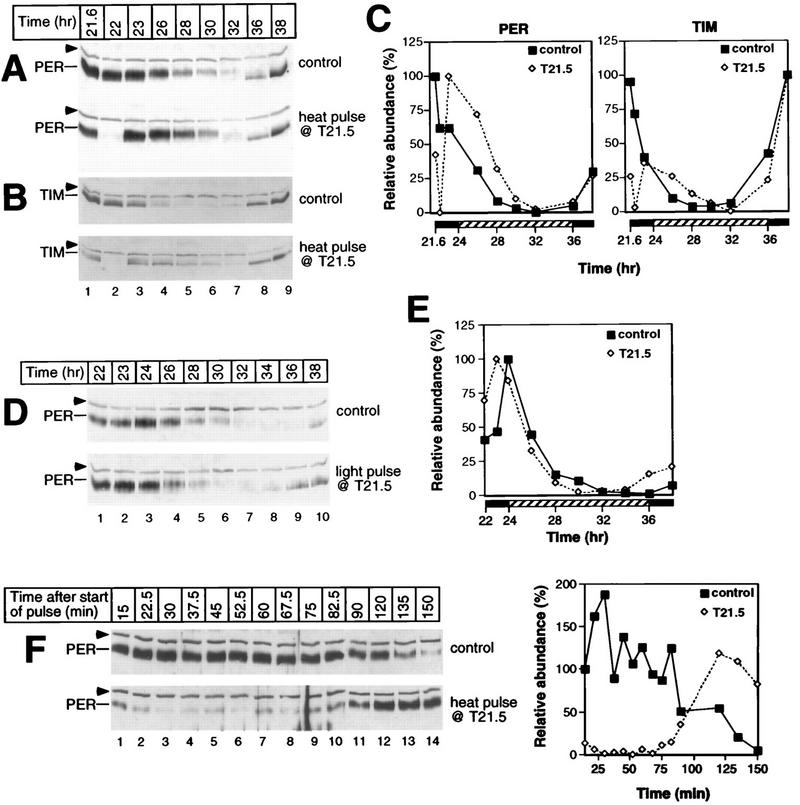
Pulses of heat and light at T21.5 produce remarkably different effects on the PER and TIM biochemical cycles. Following entrainment in LD, a group of CS flies was exposed at T21.5 to either a 30-min heat pulse at 37°C (A, B, and F) or a 30-min light pulse (D); for each treatment, another group served as controls. Total protein extracts were prepared from isolated heads and analyzed by immunoblotting in the presence of antibodies to either PER (A, D, and F) or TIM (B). The positions of PER and TIM are indicated at the left. Arrowheads mark the cross-reacting size standard. (A, B, and D) At the top is shown the time of fly collection (in hours since the last dark-light transition at ZT0). (F) At the top is shown the time of fly collection in minutes since the start of the heat pulse at T21.5. Each experiment was done at least two independent times (data not shown), and representative examples are shown. (C) Quantitation of results shown in panels A and B. (E) Quantitation of results shown in panel D. The peak value for each group of control flies was set at 100 except in panel F, where the abundance of PER in control flies collected 15 min after the start of the heat pulse (lane 1, top left panel) was set at 100.

