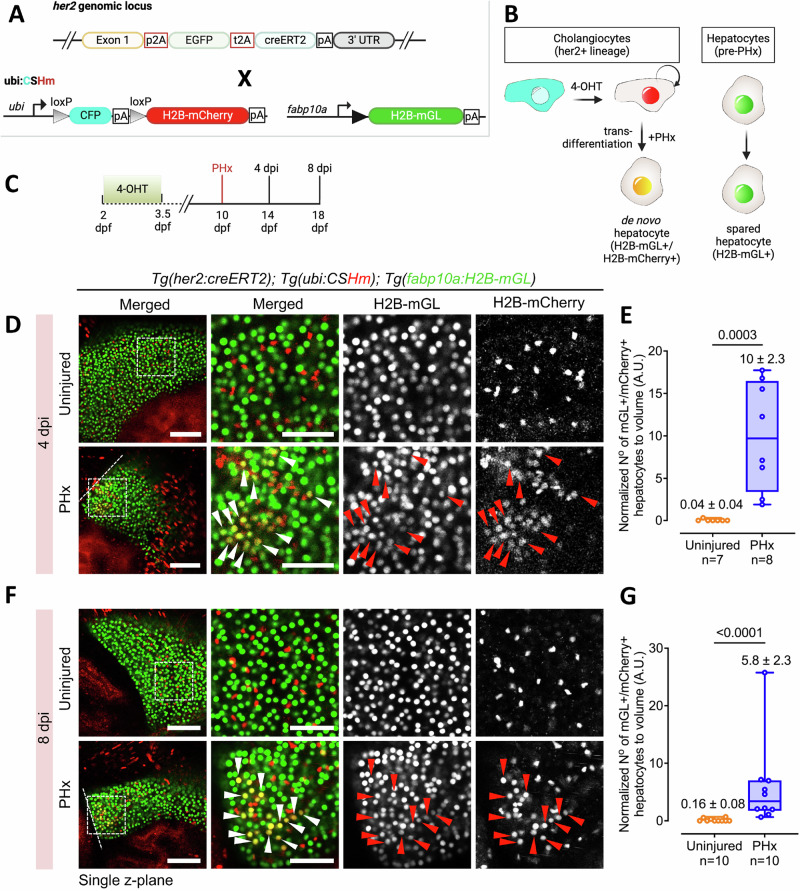
Fig. 6. her2+ cells generate hepatocytes after PHx.
A The transgenic lines used to lineage trace her2+ cells. B Schematic illustrating the tracing of her2 + -derived hepatocytes following PHx. C Experimental timeline for lineage tracing. D, F Live confocal images of left lobe in uninjured and PHx condition at 4 dpi (D) and at 8 dpi (F). Representative cholangiocyte-derived de novo hepatocytes are marked with arrowheads. Dashed line marks the border of the regenerate. E, G Min-to-max box plots showing the normalized number of H2B-mGL+/mCherry+ hepatocytes per unit volume at 4 dpi (E) and 8 dpi (G). Each dot represents one animal; mean ± SEM is indicated above each box. Statistical significance was assessed using the Two-tailed Mann–Whitney test. Sample sizes are indicated below the respective groups. Scale bars: 100 μm (left panels), 50 μm (insets) (D, F).

