
FIG. 4.
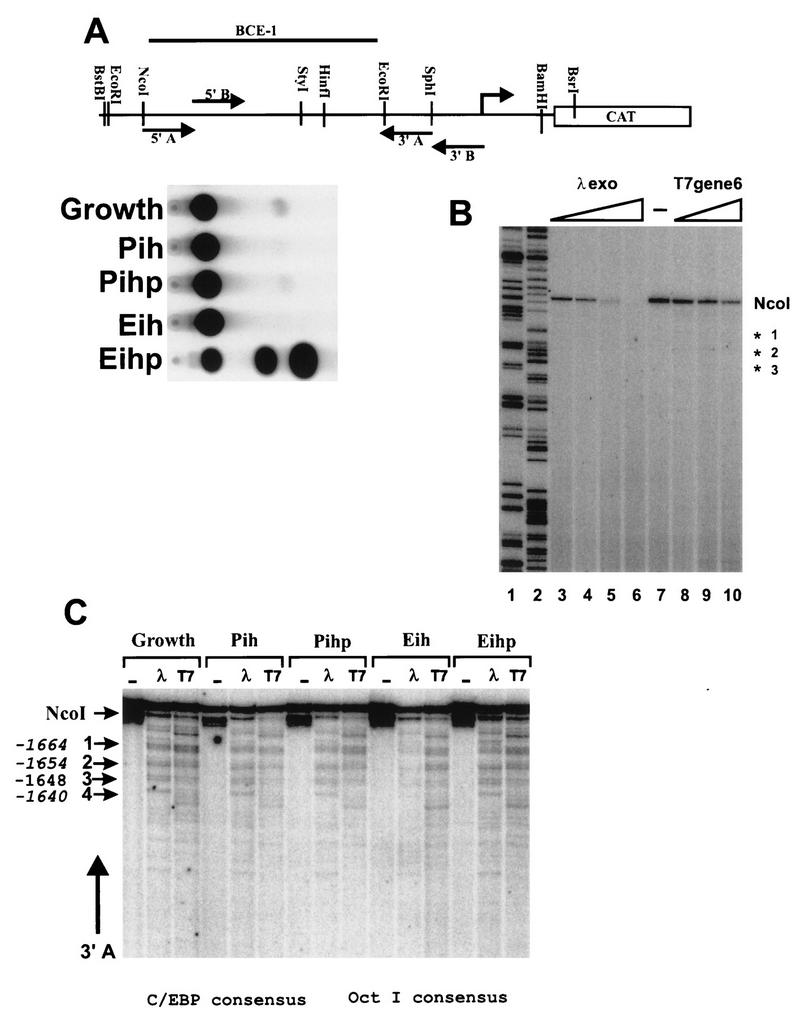
Exonuclease analysis of BCE-1 shows identical stop patterns for both the active and inactive states of the promoter for C/EBP. (A) Diagram of the BBC construct identifying the primary and secondary enzyme digestion sites and the relative location of the primers. Corresponding CAT assays of lysates collected from an aliquot of cells from each culture condition prior to nucleus isolation. The cells cultured on ECM were isolated by PBS dissolution. P, plastic; i, insulin; h, hydrocortisone; p, prolactin; E, ECM. (B) Exonuclease control for genomically induced pausing of the lambda and T7 exonucleases. Genomic DNA isolated from stably BBC-transfected CID-9 cells was cut with NcoI, and aliquots were treated with increasing amounts of exonuclease for 15 min at 37°C. DNA was purified and subjected to primer extension using labeled primer 3A. Lanes: 1 and 2, BBC plasmid DNA extended with labeled primer 3A incorporating ddGTP and ddATP, respectively; 3 to 6, 0.5, 1, 2.5, and 5 U of lambda exonuclease per μg of genomic DNA; 7, control (no exonuclease); 8 to 10, 5, 10, and 25 U of T7 exonuclease per μg of genomic DNA. (C) Exonuclease analysis of region I. NcoI was used to open the chromatin DNA for exonuclease entry. The secondary enzyme was BstBI, and primer extensions were performed with oligonucleotide 3′A. Major stops are designated by arrows 1 to 4, and their positions within the BCE-1 sequence are noted beside the arrows. The positions of the consensus sequences for C/EBP and OctI are noted below the figure.