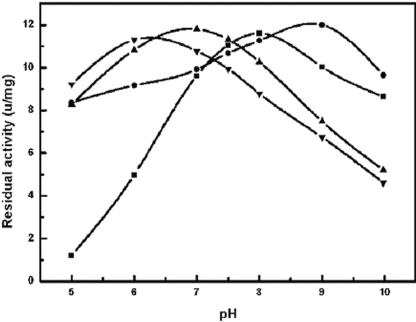
FIG. 4.
pH activity profiles of CA130 (▴), K198βA (▪), R121βA (▾), and D286βA (•). The optimal pH of K198βA and R121βA shifted the profile to the alkaline region by about 1.0 to 2.0 pH units, whereas the optimal pH of D286βA shifted downward to the basic region by about 0.8 pH units. Three independent measurements were taken for each datum point. The data are mean values of replicated experiments.

