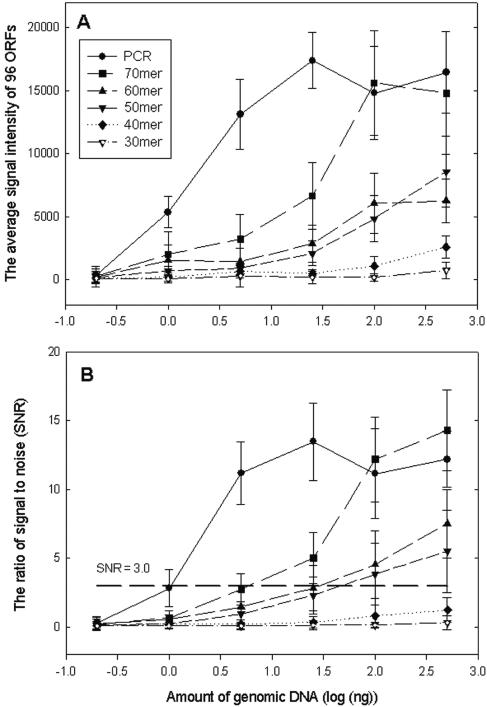
FIG. 3.
Relationships between the amount of genomic DNA (0.2, 1, 5, 25, 100, and 500 ng) and the average signal intensity (A) or the average ratio of signal to noise (B) for 96 ORFs selected from S. oneidensis MR-1. The data are averages and standard deviations for three slides. For each point there were 576 possible spots on the array.

