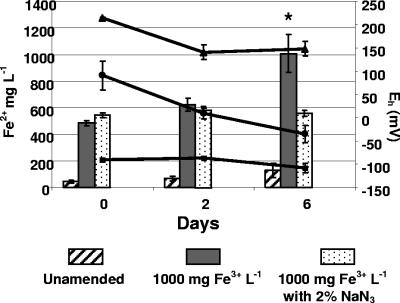
FIG. 3.
Effect of 2% NaN3 on HCl-soluble Fe2+ concentrations (left axis) and Eh (right axis) of gravel-containing manure slurry microcosms after 0, 2, and 6 days. Bar heights and error bars represent means and standard deviations of Fe2+ concentrations in microcosms with no FeCl3 added (Unamended), with FeCl3 to obtain 1,000 mg Fe3+ liter−1, and with FeCl3 to obtain 1,000 mg of Fe3+ liter−1 plus 2% NaN3. Lines show Eh for microcosms with no FeCl3 added ▪,with FeCl3 •, and FeCl3+2% NaN3 ▴. Means and standard deviations in both data sets are from three independent experiments. The star above the column for day 6, no inhibitor, indicates a significantly higher mean Fe2+ concentration (P < 0.05) based on a paired t test with the mean from microcosms with NaN3.

