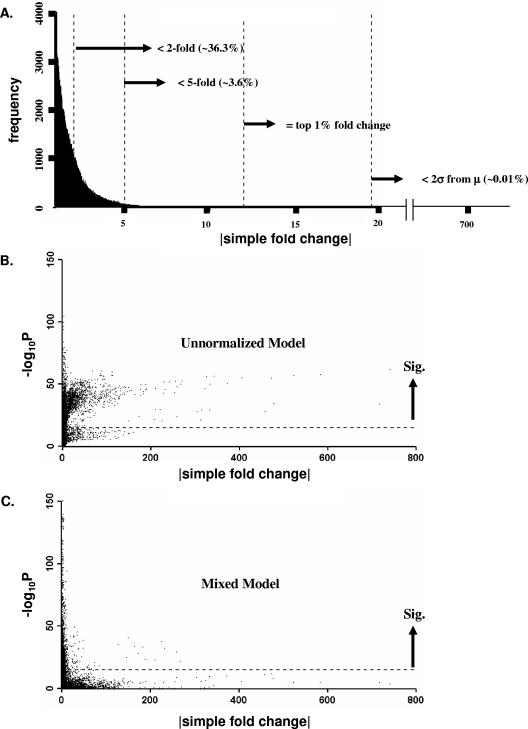
FIG. 2.
Gene expression calls for three different methods. (A) Shown is the distribution of simple fold change calls. Simple fold change was calculated by dividing the mean signal intensities from one sample by the mean signal intensities from a comparison sample, after balancing Cy3/Cy5 signal intensity channels across arrays. (B) Unnormalized log2-transformed significance measures are shown as a function of simple fold changes. (C) Mixed model significance versus simple fold changes. A total of 148,368 comparisons were made in the experiment. The dotted lines in panels B and C correspond to a Bonferroni corrected significance level (α) of 3.37 × 10⁻⁷, representing a conservative cutoff that bounds the experiment-wise false-positive error rate at 0.05. Statistical tests based on unnormalized estimate differences were in close agreement with simple fold change methods for fold changes greater than 10-fold (data not shown), but estimates resulting from mixed model analyses did not depend strongly on degree of fold change for any fold change threshold.

