
FIG. 4.
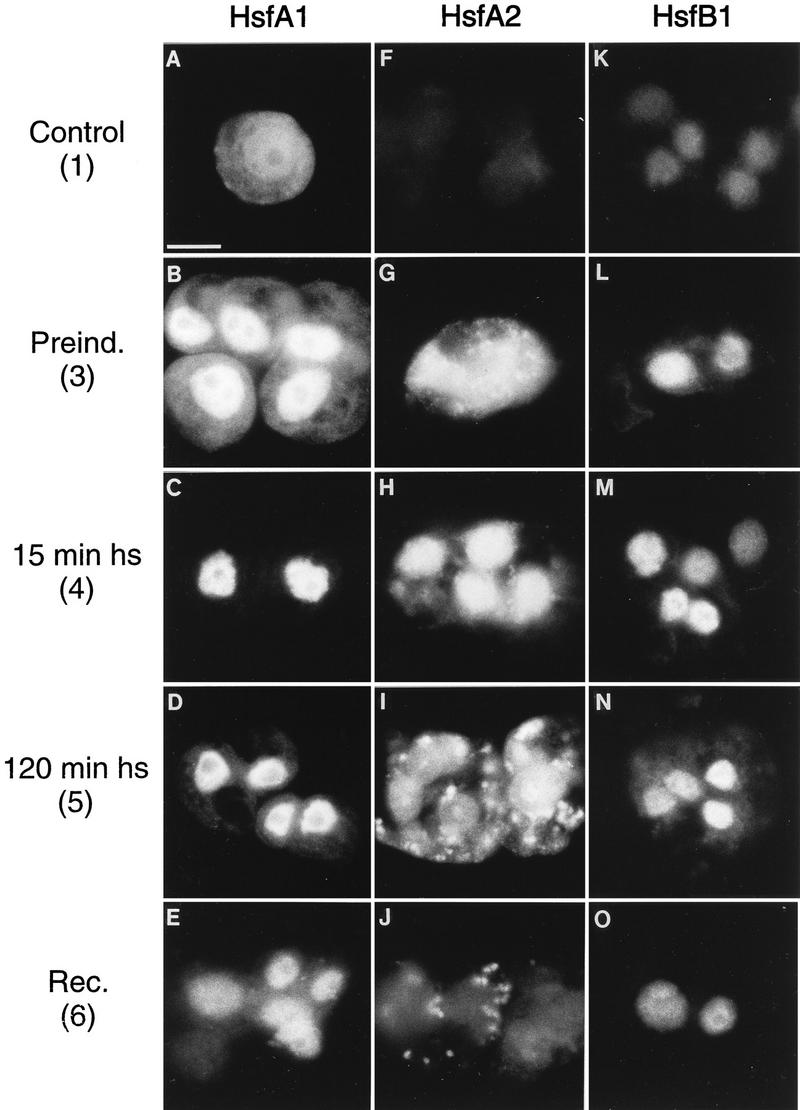
Intracellular localization of HsfA1 and HsfA2 in tomato cell cultures. Cells were harvested in the course of an HS treatment as indicated by the numbers, which refer to the pictograph in Fig. 3. Samples were processed for immunofluorescence with antiserum against HsfA1 (A to E), antiserum against HsfA2 (F to J), and antiserum against HsfB1 (K to O). The speckled cytoplasmic fluorescence in panels I and J results from the accumulation of HsfA2 in HSG (see Fig. 5). Bar, 10 μm.