
Figure 1.
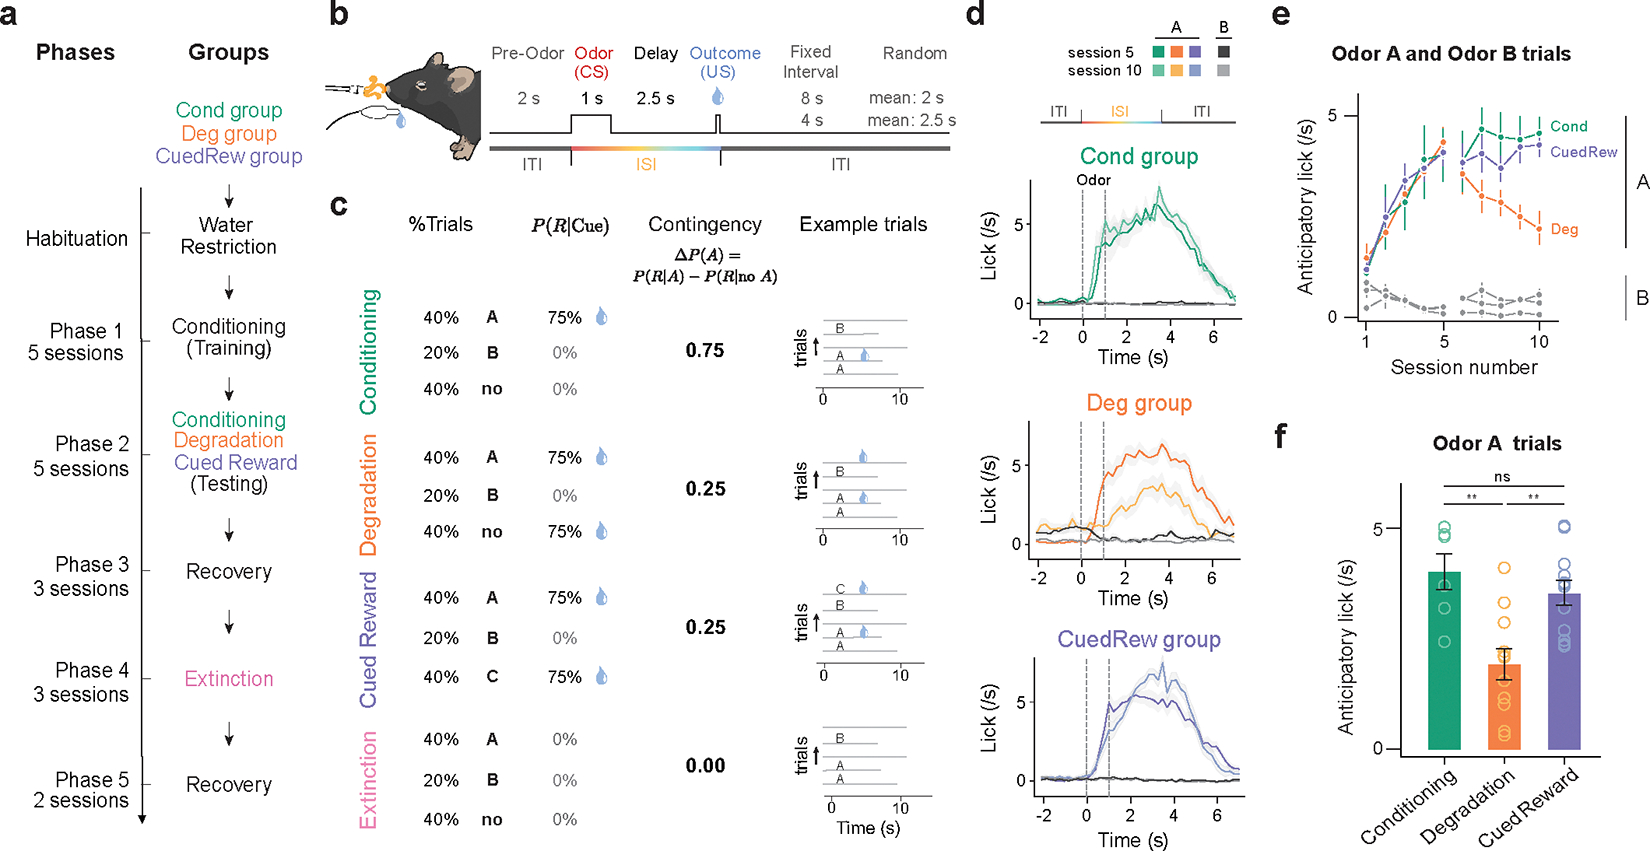
Dynamic changes in lick response to olfactory cues across different phases of Pavlovian contingency learning task.
(a) Experimental design. Three groups of mice subjected to four unique conditions of contingency learning. All animals underwent Phases 1 and 2. Deg group additionally underwent Phases 3–5.
(b) Trial timing.
(c) Trial parameters per condition. In Conditioning, Degradation and Cued Reward, Odor A predicts 75% chance of reward (9 μL water) delivery, Odor B indicates no reward. In Degradation, blank trials were replaced with uncued rewards (75% reward probability). In Cued Reward, these additional rewards were cued by Odor C. In Extinction, no rewards were delivered.
(d) PSTH of average licking response of mice in three groups to the onset of Odor A and Odor B from the last session of Phase 1 (session 5) and Phase 2 (session 10). Shaded area is standard error of the mean (SEM). Notably, the decreased licking response during ISI and increased during ITI in Deg group. (green, Cond group, n = 6; orange, Deg group, n = 11; purple, CuedRew group, n = 12 mice).
(e) Average lick rate in 3s post-cue (Odor A or B) by session. Error bars represent SEM.
(f) Average lick rate in 3s post Odor A in final session of each condition. Asterisks denote statistical significance: ns, P > 0.05; **, P < 0.01, indicating a significant change in licking behavior to Odor A in Deg group across sessions using 2-sided mixed-effects model with Tukey’s HSD post-hoc tests (Cond vs CuedRew, p = 0.77; Cond vs Deg p = 0.0011; CuedRew vs Deg: p = 0.008)