
Extended Data Fig. 3 |. Population Average Dopamine Response per session.
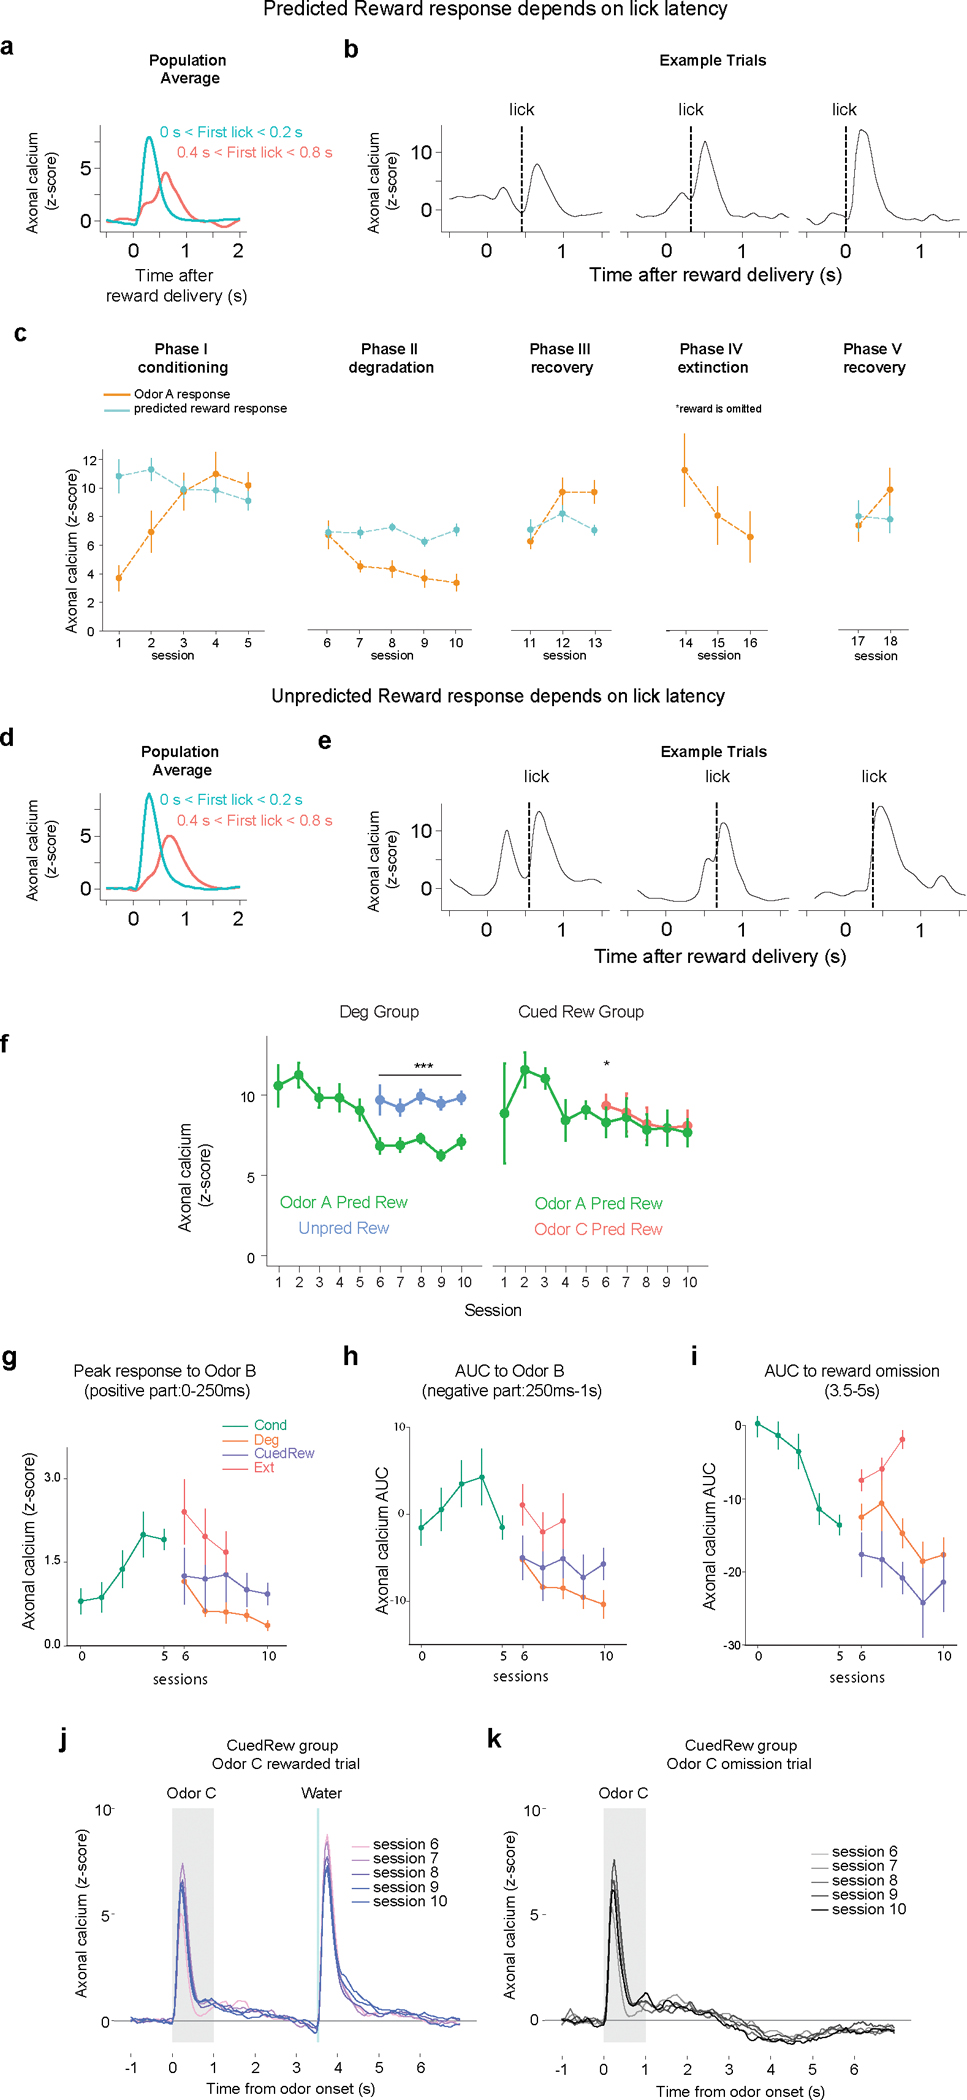
(a) Predicted reward response in Odor A trials for trials in which the first lick after reward delivery was recording within 200 ms (green) or between 400 and 800 ms (red). There is a biphasic response pattern in the slow licks, suggesting there may be sensory cues associated with reward delivery that act as conditioned stimuli
(b) Three consecutive trials from the same animal in the same session, showing the effect of lick time. The dotted line indicates the first recorded lick after reward delivery. The lick timing has an effect on the height and shape of the response.
(c) Mean peak dopamine axonal signal (z-scored) of cue response (orange) and reward response (cyan) in Odor A rewarded trial by sessions for the Deg group (n=8) across multiple phases: Conditioning (Phase I), Degradation (Phase II), Recovery (Phase III), Extinction (Phase IV), and post-Extinction Recovery (Phase V). Except in extinction, only trials in which the first lick was recorded under 250 ms was included in this analysis
(d) As in panel A, for unpredicted rewards delivered in the degradation condition.
(e) Example in three trials from the same session and animal of the response to unpredicted reward. The dotted line indicates the first recorded lick.
(f) Reward responses by session and by group. In the degradation group (n=8), the unpredicted reward elicited greater responses than the reward delivered after Odor A on all sessions (mixed-effect model, p<0.001, within animal comparison). In the Cued Rew group (n=5), the reward delivered after Odor C elicited a greater response than the reward delivered after Odor A on the first session of Cued Rew condition (two sided mixed-effect model, p<0.05, within animal comparison)
(g, h, i) Mean peak dopamine axonal signal (z-scored) across sessions for four distinct conditions, represented for various events.
(j) Response to Odor C (rewarded) and (k) Odor C (omission), population average per session
In all panels, error bars are SEM.