
Extended Data Fig. 5 |. Microstimuli simulation.
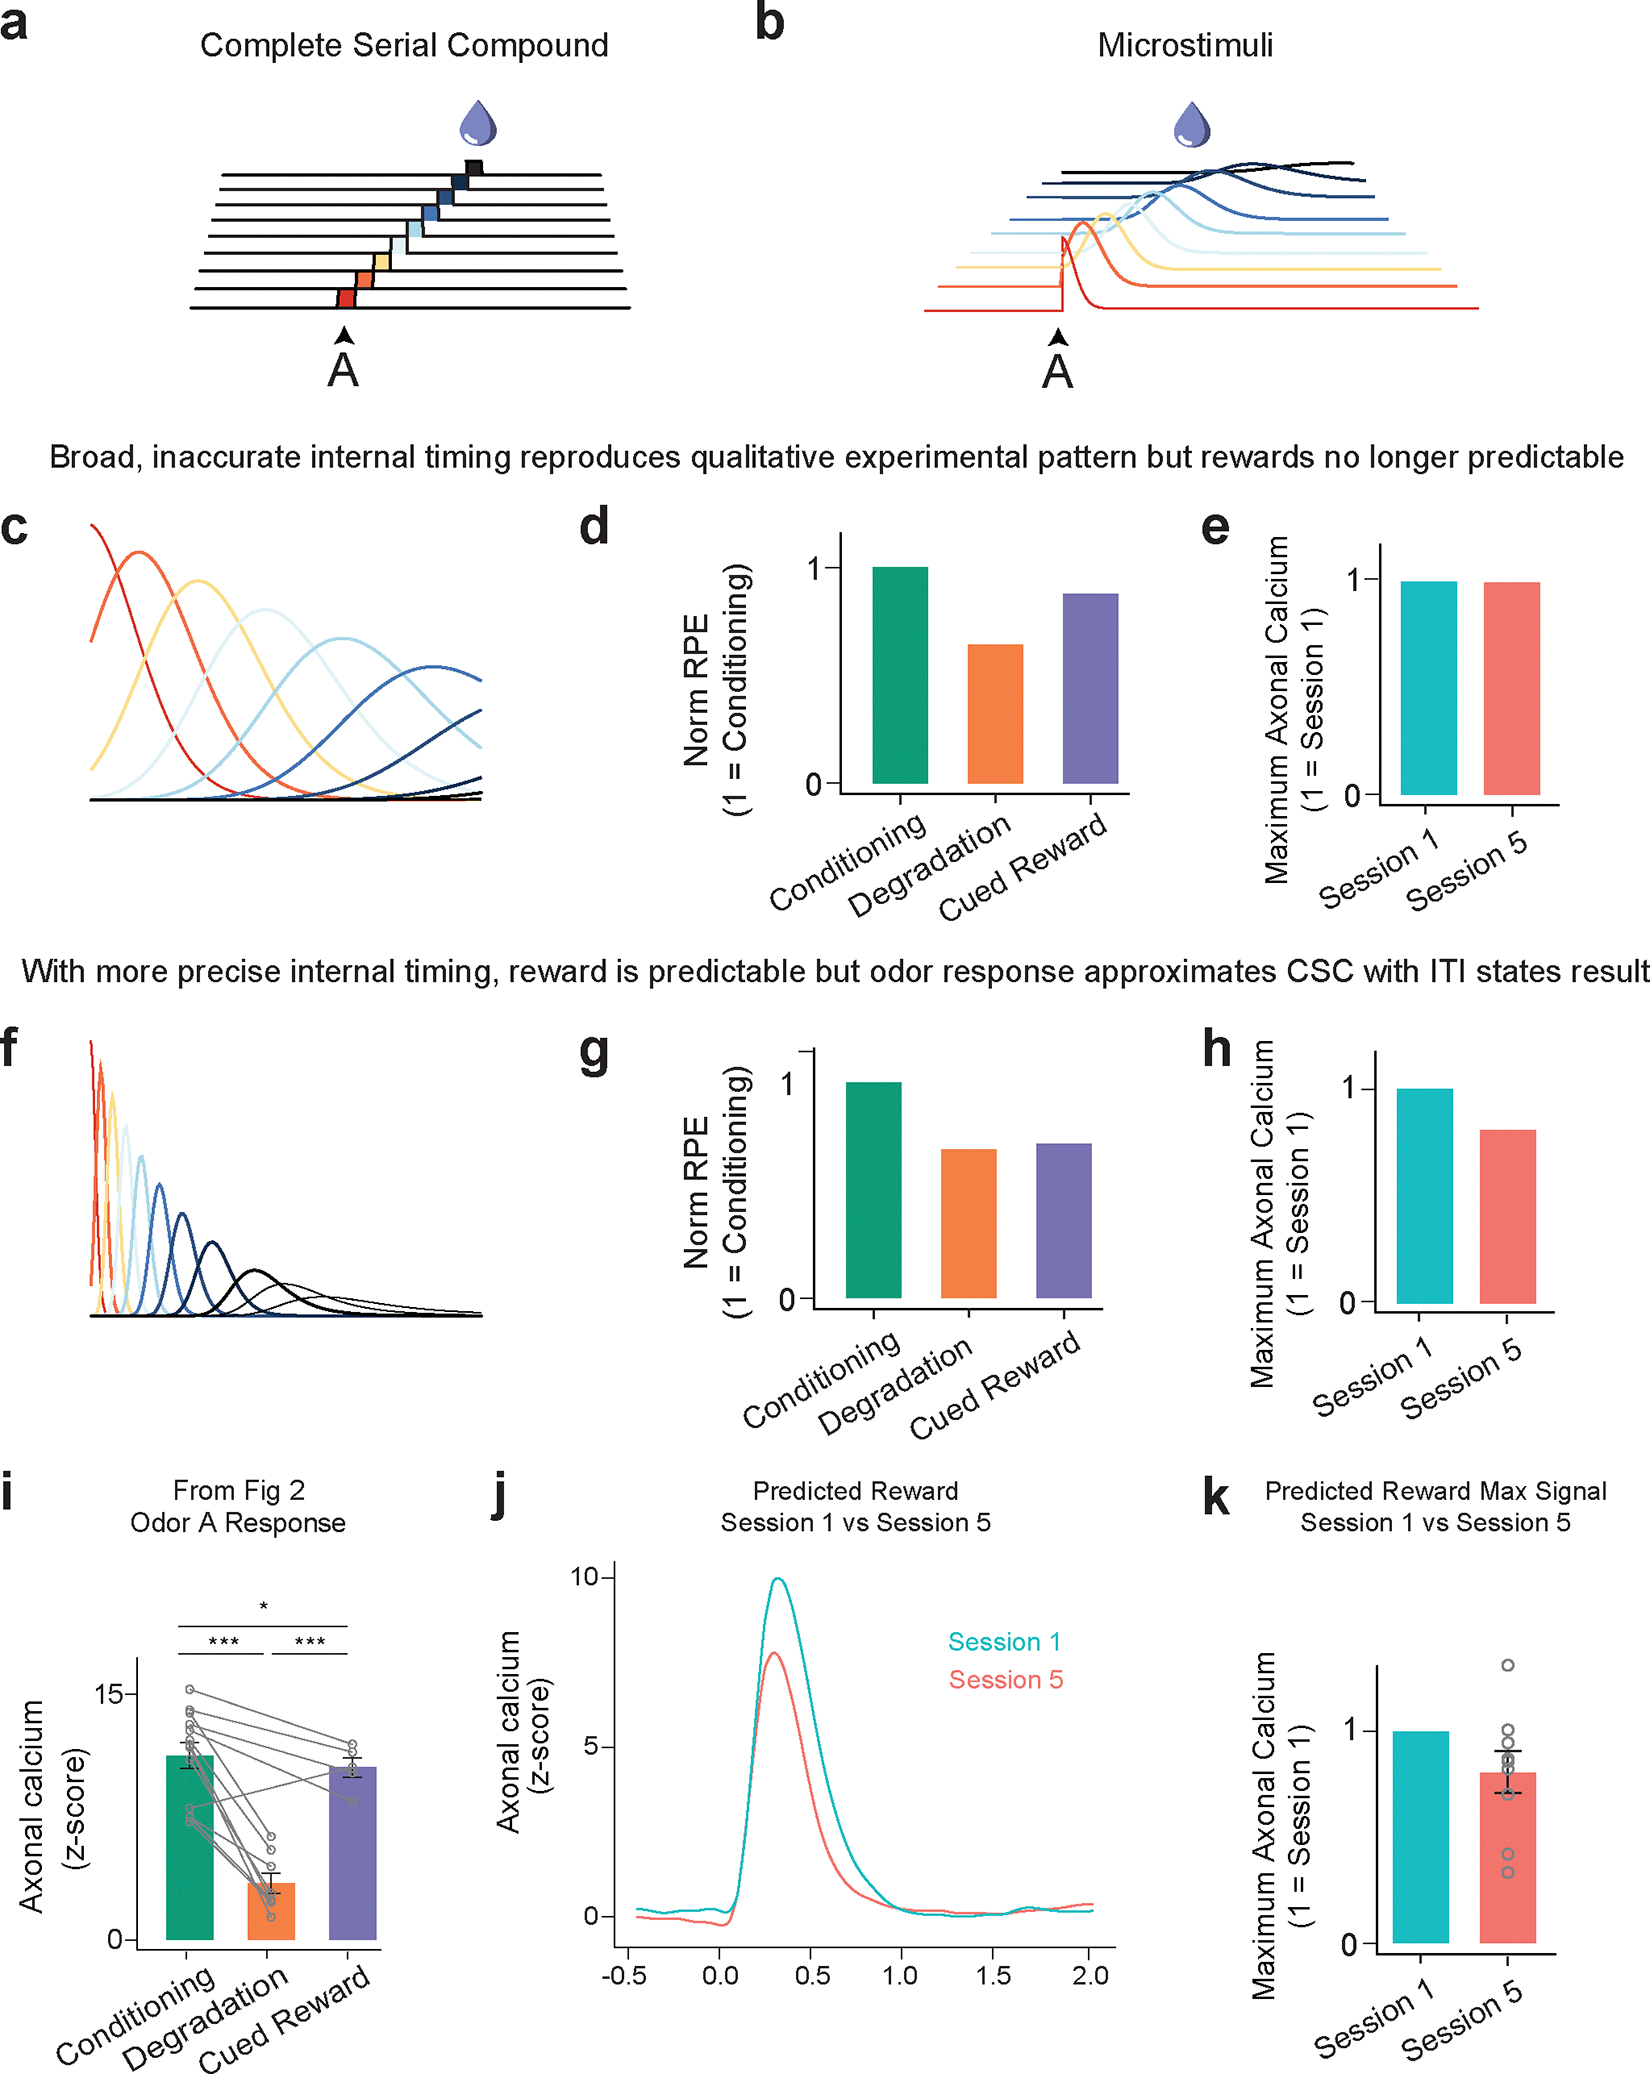
(a) Complete serial compound state spaces assume non-overlapping microstates
(b) Microstimuli state space representation assumes each stimuli produces a sequence of microstimuli that diminish in height (diminishing relative contribution) and grow in width (growing temporal imprecision).
(c) High σ and low η microstimuli simulations have low temporal precision – each state significantly overlaps with the previous
(d) With low temporal precision, microstimuli behaves like the Cue-Context model, reproducing the pattern of results qualitatively but not quantitatively.
(e) However, at this level there is no expected decrease in the predicted reward response, as the timing in insufficiently accurate.
(f) In the opposite situation, with low σ and high η, microstimuli state representations have higher precision in time
(g) However, in this case it suffers from the same issues as the CSC-with-ITI states model, predicting little difference between the Cued Reward and Degradation conditions
(h) Microstimuli help explains why the decrease in predicted reward response is not as predicted by CSC models, in which the reward is perfectly predictable (and thus the reward response following 75% reward probability cues should be 25% the magnitude of an unpredicted reward).
(i) From figure 2, mean peak dopamine axonal signal for the last session in Phase 1 (Conditioning) and 2 (Degradation and Cued Reward) for both Deg (n=8) and CuedRew (n=5) groups. Error bars represent SEM. ***, P < 0.001 in two-sided mixed-effects model with Tukey HSD posthoc.
(j) Predicted reward response following Odor A in session 1 (green) versus session 5 (red).
(k) Maximum axonal calcium response for predicted reward response following Odor A in session 1 versus session 5 (n = 13). Normalized by subject to session 1. Error bars represent SEM.