
Extended Data Fig. 6 |. Comparison of reward and omission responses between experimental data, Belief-State model and value-RNN predictions.
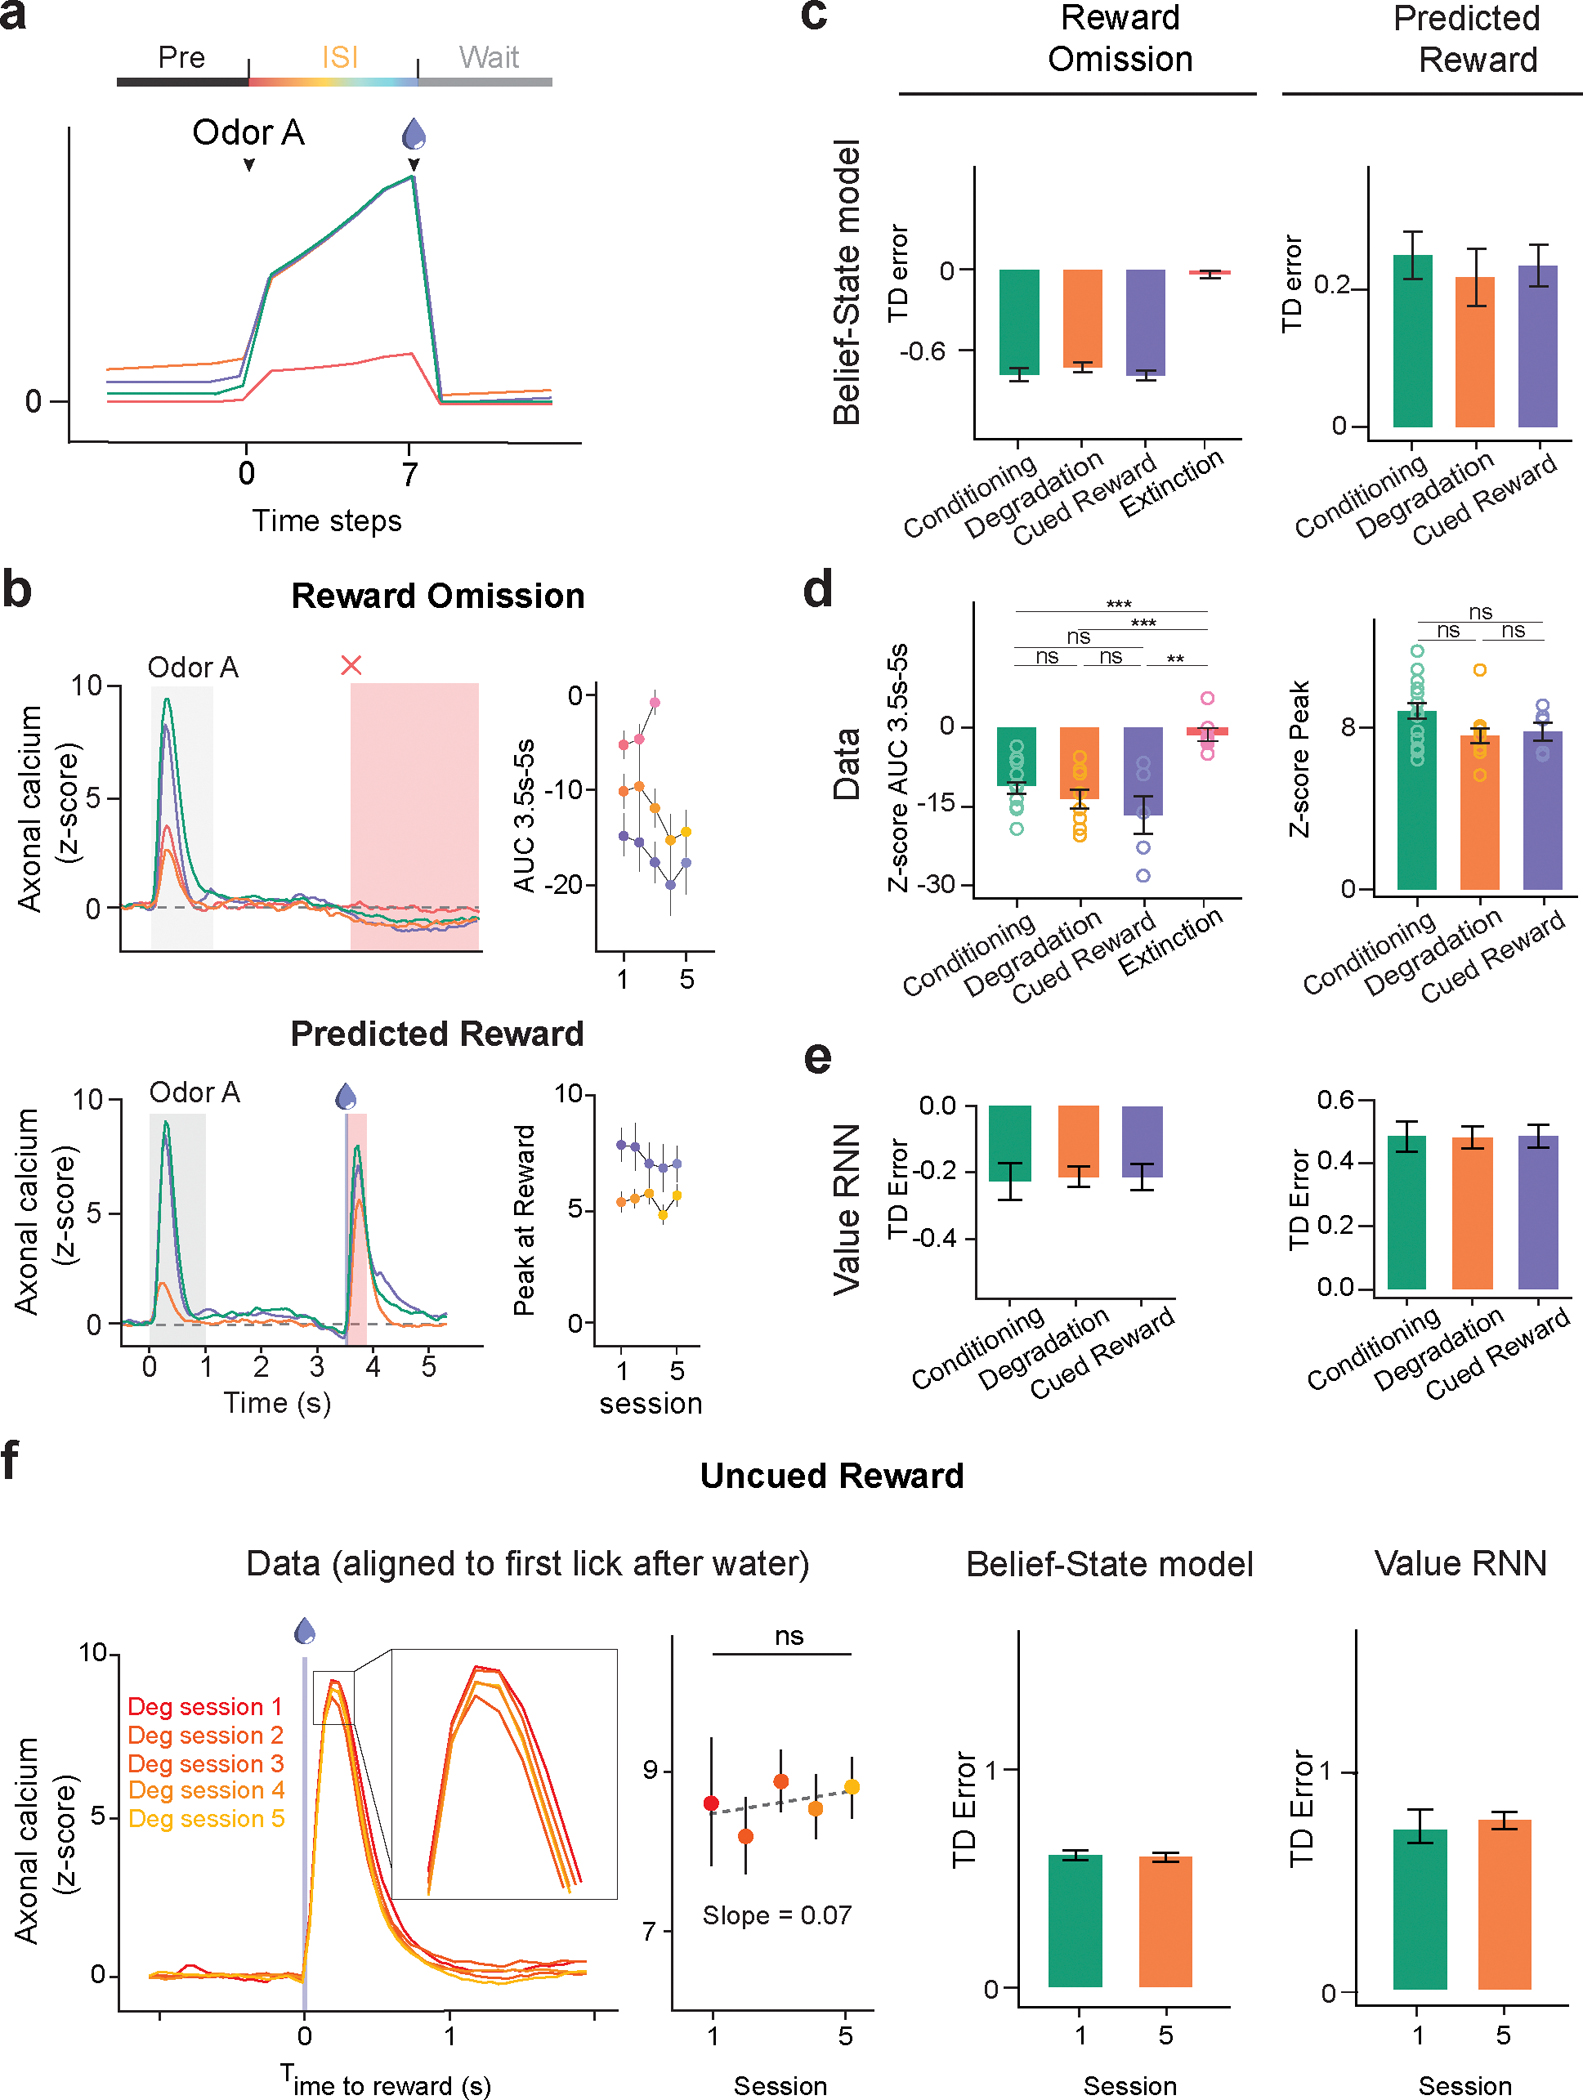
(a) Plots averaged from one representative simulation of Odor A rewarded trial (n = 4,000 simulated trials) for four distinct conditions using the Belief-State model. Graphs are for the corresponding value function of Odor A rewarded trials, with Pre state, ISI state and Wait state annotated.
(b) Z-scored DA axonal signals to reward omission and predicted reward following Odor A quantified from the red shaded area. Line graphs (right) shows mean z-scored response over multiple sessions for each condition. Statistical analysis was performed on data from the first and last session of these conditions. Error bars are SEM. ns, P > 0.05; **, P < 0.01, paired t-test.
(c) The predictions of the Belief-State model for reward omission and predicted reward (mean, error bars: SD).
(d) The experimental data for reward omission and predicted reward (mean, error bars: SEM). ns, P > 0.05; **, P < 0.01; ***, P < 0.001, Welch’s t-test.
(e) The predictions of the Value-RNN models for reward omission and predicted reward (mean, error bars: SD).
(f) The experimental data, TD error prediction by Belief-State model and Value-RNN model for uncued reward response in Degradation condition. While the Belief-State model captured the downward trend in response magnitude, none of the three statistical tests showed significant changes.