
Figure 2.
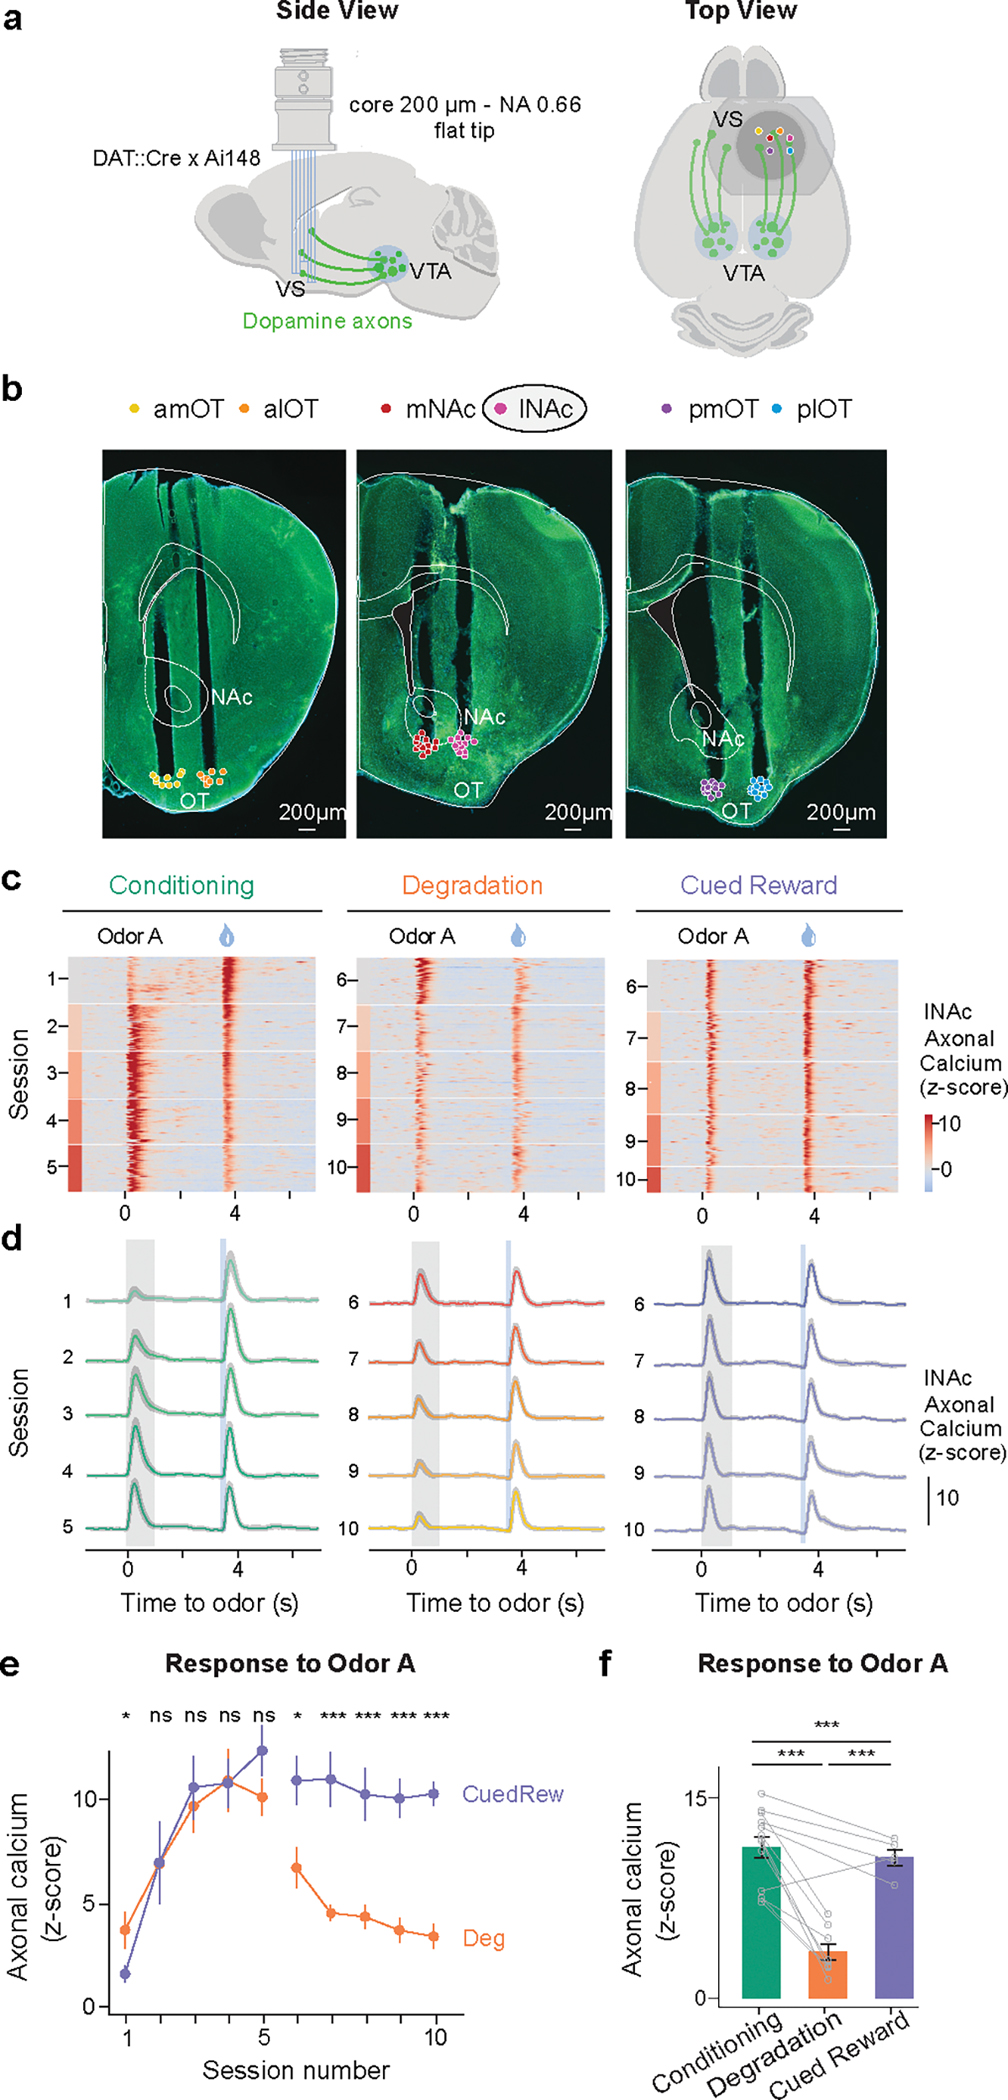
Dopamine axonal activity recordings show different responses to rewarding cues in Degradation and Cued Reward conditions.
(a) Configuration of multifiber photometry recordings.
(b) Coronal section from one DAT::cre x Ai148 mouse showing multiple VS fiber tracts. Only lNAc data presented in main results. lNAc, Lateral nucleus accumbens; mNAc, Medial NAc; alOT, anterior lateral olfactory tubercle; plOT, posterior lateral OT; amOT, anterior medial OT; pmOT, posterior medial OT. Points overlayed show the aligned placement for all animals (n=13).
(c) Heatmap from two mice (mouse 1, left two panels, mouse 2, right panel) illustrating the z-scored dopamine axonal signals in Odor A rewarded trials (rows), aligned to the onset of Odor A for three conditions.
(d) Population average z-scored dopamine axonal signals in response to Odor A and water delivery. Shaded areas represent SEM.
(e) Mean peak dopamine axonal signal of Odor A response by sessions for the Deg group (orange, n=8) and the CuedRew group (purple, n=5; two-sided mixed-effects model).
(f) Mean peak dopamine axonal signal for the last session in Phase 1 (Conditioning) and 2 (Degradation and Cued Reward) for both Deg (n=8) and CuedRew (n=5) groups. In panels E and F: error bars represent SEM. ns, P >0.05; *, P<0.05 ***, P < 0.001 in two-sided mixed-effects model with Tukey HSD posthoc.