
Figure 4.
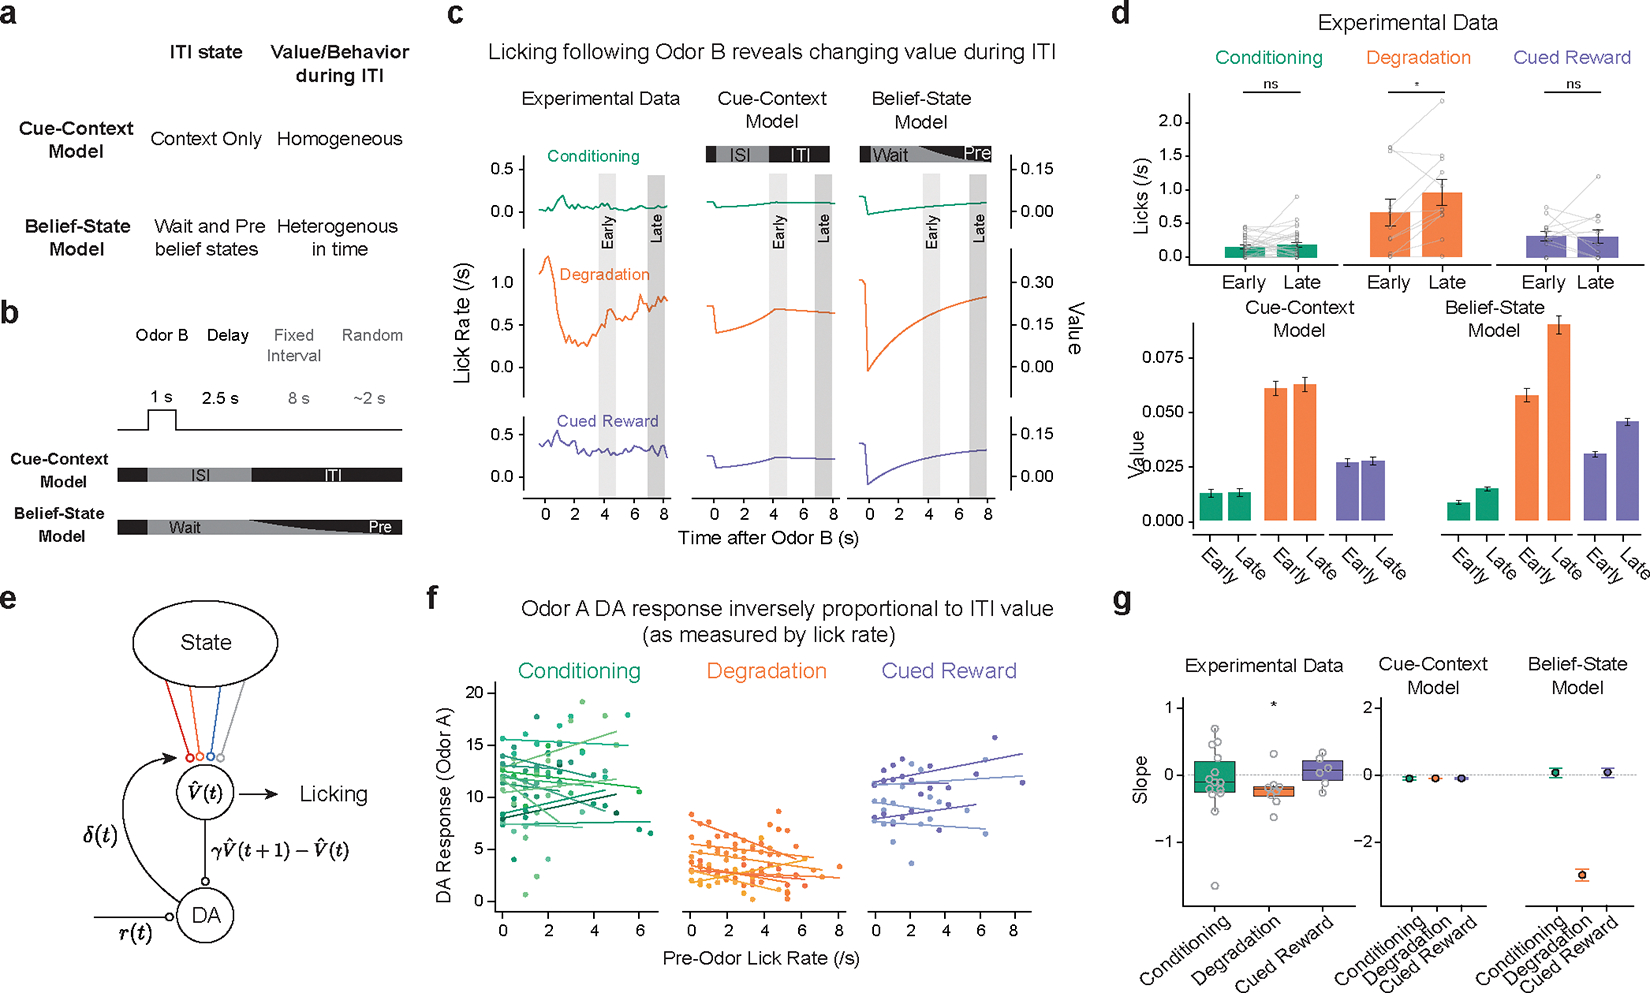
Belief-State model, but not Cue-Context model, explains variance in behavior and dopamine responses.
(a) Cue-Context model and Belief-State model differ in their representation of the ITI.
(b) Odor B predicts no reward and at least 10 s before the start of the next trial. An ideal agent waits this out, only licking late in the ITI.
(c) Odor B induces a reduction in licking, particularly in the Degradation condition, which matches the pattern of value in the Belief-State model better than the Cue-Context model.
(d) Quantified licks (top) from experimental data in early (3.5–5s) and late (7–8s) post cue period. Error bars are SEM, *, P < 0.05, two-sided paired t-test (Conditioning, p = 0.457, n = 30; Degradation: p = 0.0413; n=11; CuedReward: p = 0.92, n = 13). Value from Cue-Context and Belief-State model for the same time period, error bars are SD.
(e) If licking is taken as a readout of value, then ITI licking should be inversely correlated with dopamine.
(f) Per animal linear regression of Odor A dopamine response (z-score axonal calcium) on lick rate in 2s before cue delivery in last two sessions of each condition.
(g) Summarized slope coefficients from experimental data (left) and models (right). Boxplot shows median and IQR; whisker are 1.5× IQR, one sample two-sided t-test (Conditioning, p = 0.27, n= 13; Degradation: p=0.057, n= 8; Cued Reward: p = 0.070, n = 5)