
Figure 5.
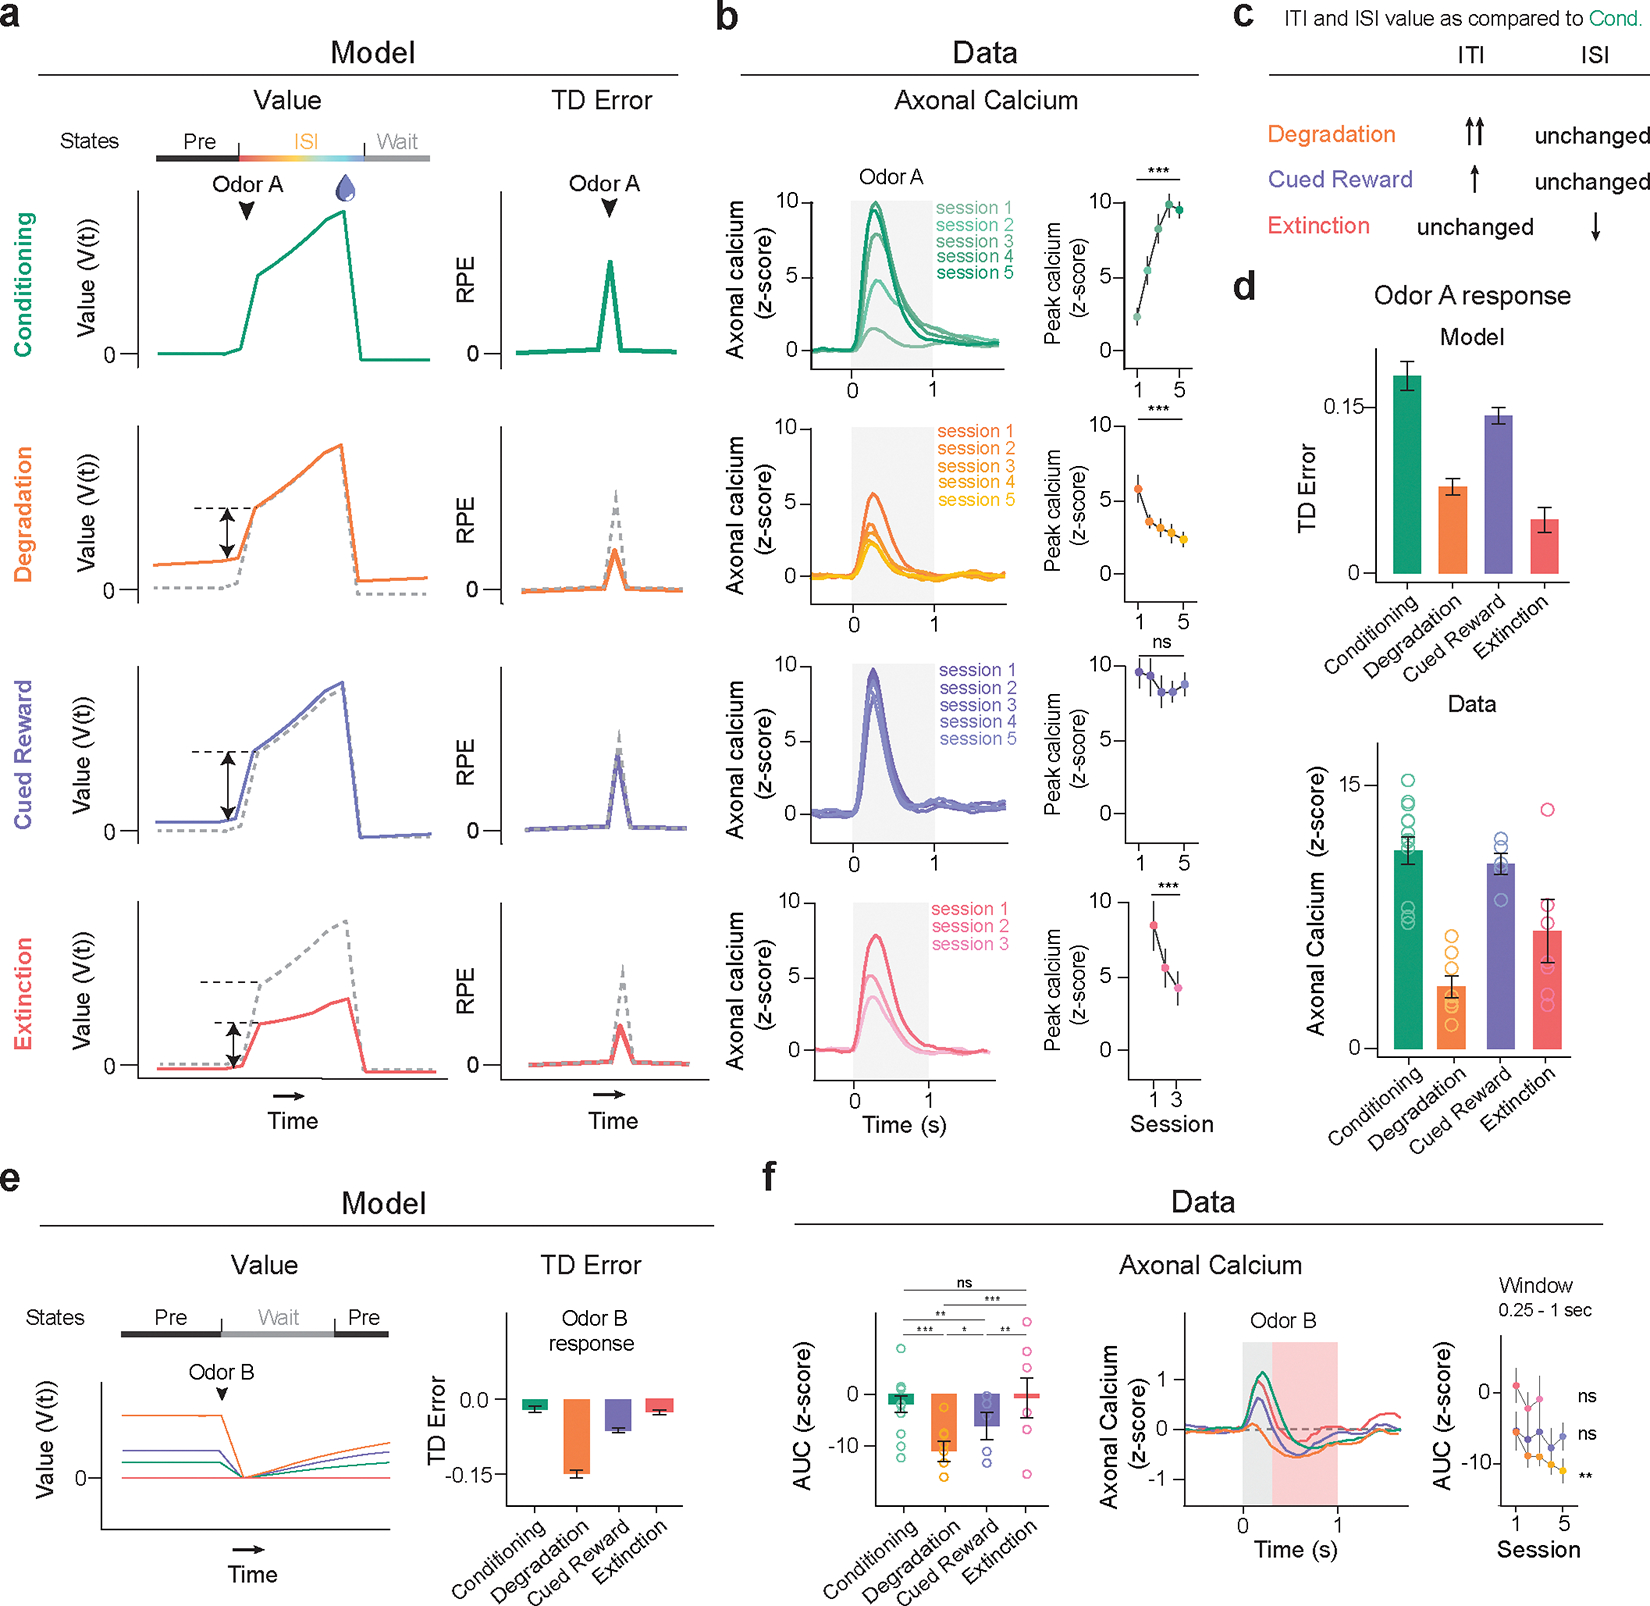
Belief-State model’s predictions recapitulate additional experimental data. For all experimental summary data, n = 13 (conditioning), n = 8 (degradation), n = 5 (cued reward) and n = 7 (extinction). Error bars are SEM. ns, P >0.05; * P < 0.05, **, P < 0.01, *** P < 0.001. For all model summary n = 25 (all conditions) and error bars are SD.
(a) Plots averaged from one representative simulation of Odor A rewarded trial (n = 4,000 simulated trials) for four distinct conditions using the Belief-State model. Graphs are for the corresponding value function (left) and TD error (right) of cue response for Odor A rewarded trials.
(b) Signals from dopamine axons (mean) across multiple sessions of each condition (left). Mean peak dopamine axonal calcium signal (z-scored) for the first to last session in Phase 2 for four contingency conditions (right). Two-sided mixed-effects model. P = 0.137 for Cued Reward, P < 0.001 all other comparisons. The Belief-State model captures the modulation of Odor A dopamine response in all conditions.
(c) Degradation, Cued Reward and Extinction conditions differ in how their ITI and ISI values change compared to Conditioning phase.
(d) Mean peak TD error by Belief-State model and dopamine axonal signal (z-scored) to Odor A for four distinct conditions. The model’s prediction captured well the pattern in the dopamine data. All pairwise difference at P<0.001 are significant using two-sided mixed-effects model with Tukey’s HSD post-hoc test.
(e) Averaged traces from a representative simulation of Odor B trial (n = 4000 simulated trials) across four distinct conditions using the Belief-State model. Graphs are for the value function and TD errors of cue response for Odor B trials.
(f) Z-scored dopamine axonal signals to Odor B quantified from the red shaded area to quantify the later response only. Bar graph (left) shows mean z-scored Odor B AUC from 0.25s-1s response from the last session of each condition. Two-sided mixed-effects model with Tukey HSD post hoc. (Cond vs Cued Rew: P = 0.007; Cond vs Ext: P = 0.43; Deg vs CuedRew: P = 0.035; CuedRew vs Ext: P = 0.0051, all other P<0.001). Line graph (right) shows mean z-scored AUC over multiple sessions for each condition. Two-sided mixed-effects model, first and last sessions of these conditions (Degradation: P<0.001; CuedRew P = 0.62; Extinction P = 0.74).