
Figure 7.
ANCCR does not explain the experimental results:
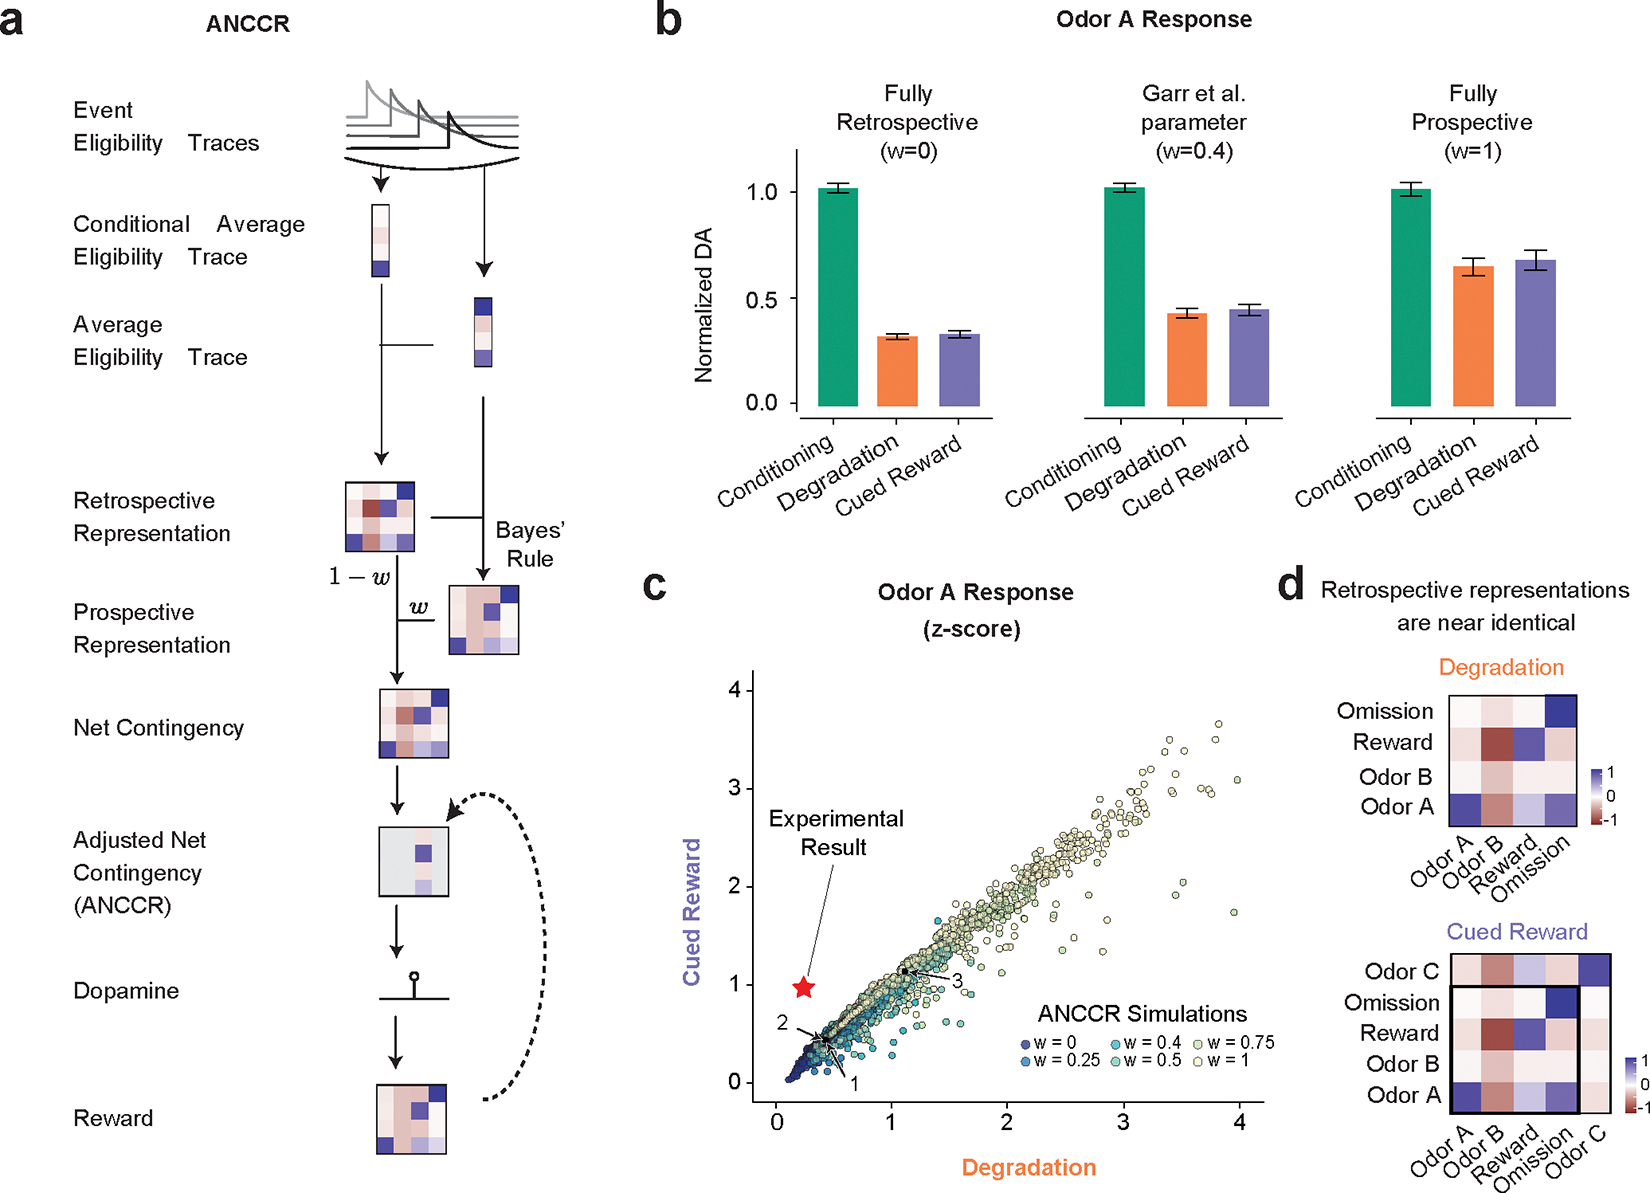
(a) Simplified representation of ANCCR model. Notably the first step is to estimate retrospective contingency using eligibility traces.
(b) Simulations of the same virtual experiments (n = 25) used in Figure 3 using ANCCR, using the parameters in Garr et al., 2024 varying the prospective-retrospective weighting parameter (w). Error bars are SD. In all cases the predicted Odor A response is similar in the Degradation and Cued Reward conditions.
(c) No parameter combination explains the experimental result. Searching 21,000 parameter combinations across six parameters (T ratio = 0.2–2, α = 0.01–0.3, k = 0.01–1 or 1/(mean inter-reward interval), w =0–1, threshold = 0.1–0.7, αR = 0.1–0.3). Experimental result plotted as a star. Previously used parameters (Garr et al., 2024 as 1, Jeong et al., 2022 as 2 and 3) indicated. Dots are colored by the prospective-retrospective weighting parameter (w), which has a strong effect on the magnitude of Phase 2 response relative to Phase 1.
(d) As the contingency is calculated as the first step, and the contingencies are similar in Degradation and Cued Reward conditions, there is little difference in the retrospective contingency representation between the two conditions, explaining why regardless of parameter choice ANCCR predicts similar responses.