
Extended Data Fig. 1 |. Population Average Behavior per session.
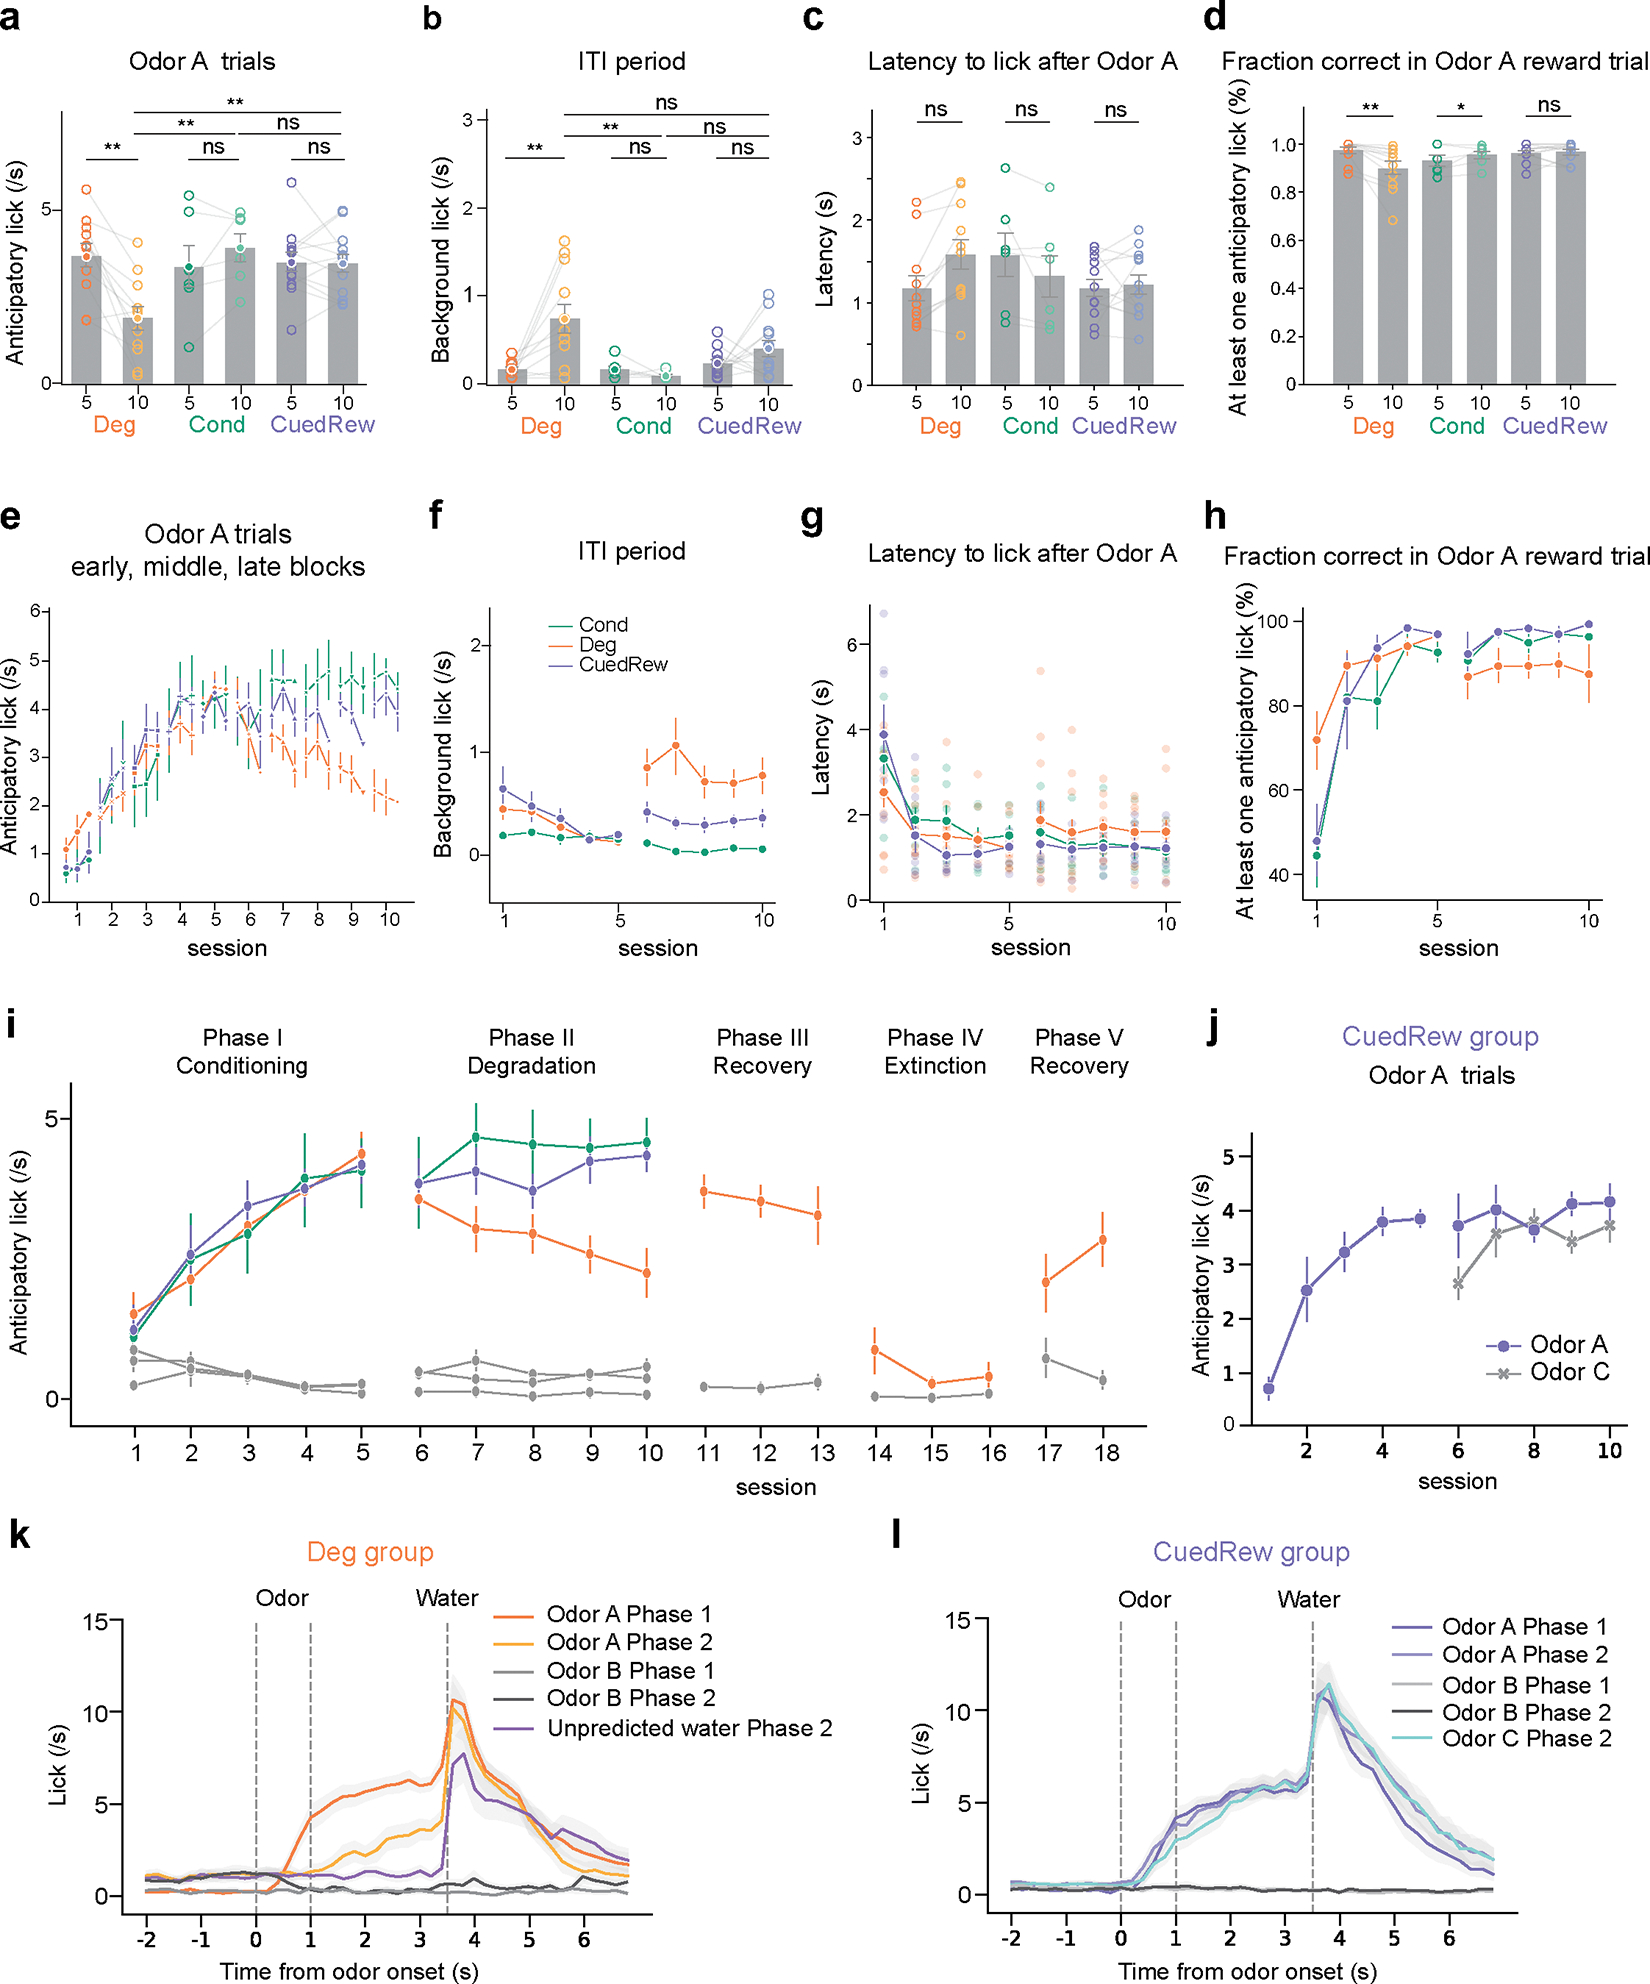
For all panels: Deg group, n = 11; Conditioning, n = 6; Cued Reward n=12. Error bars are SEM.
(a, b, c, d) Bar graphs comparing the average number of licks to Odor A during the first 3s post-stimulus (a) and during ITI (b), latency to lick (c), and fraction correct (d) in the final sessions of phase 1 and phase 2 for Deg, Cond, and CuedRew groups. Error bars represent SEM. Asterisks denote statistical significance: ns p > 0.05, **p < 0.01, paired two-sided Student’s t-test
(e) Session-wise variation in anticipatory licking for Odor A trials, broken down into early, middle, and late blocks, for all groups.
(f, g, h). Line graphs showing the average number of licks to Odor A (colored) during ITI (g), latency to lick after Odor A and fraction correct in Odor A trials for each session in the Conditioning, Degradation, and Cued Reward phase
(i) Anticipatory licking rate in Odor A trials (colored) and in Odor B trials (grey) across multiple phases: Conditioning (Phase I), Degradation (Phase II), Recovery (Phase III), Extinction (Phase IV), and post-Extinction Recovery (Phase V).
(j) Anticipatory licking to Odor C develops quickly compared to Odor A, potentially reflecting generalization.
(k, l) PSTH showing the average licking response of mice in Deg group (k) and CuedRew group (l) to the various events. The response is time-locked to the odor presentation (time 0). The shaded area indicates the standard error of the mean (SEM).