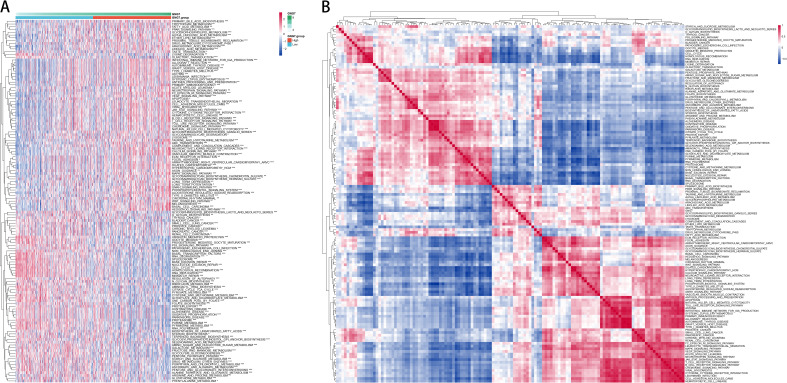
Figure 4.
Functional enrichment of GNG7-related pathways in cancer. (A) GSVA heatmap showing distinct pathway enrichment profiles in GNG7 high- and low-expression groups. (B) ssGSEA-based pathway correlation analysis reveals functional differences between groups. GSVA, Gene Set Variation Analysis; ssGSEA, single-sample Gene Set Enrichment Analysis.

