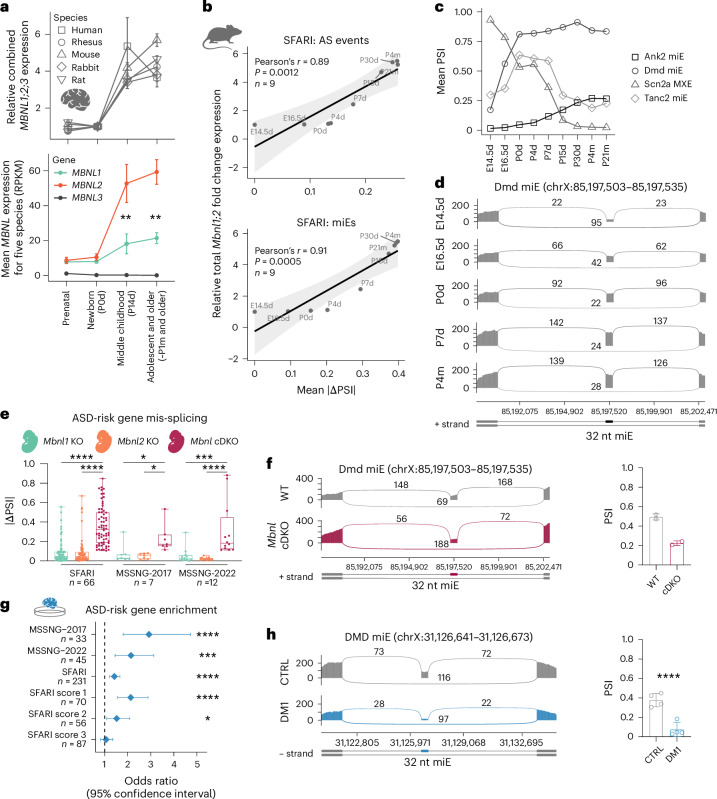
Fig. 3. MBNL proteins govern developmental splicing transitions in ASD-risk genes.
a, MBNL1, MBNL2 and MBNL3 gene expression levels in developing brains of five species: human (n = 49), rhesus (n = 17), mouse (n = 51), rabbit (n = 57) and rat (n = 57). Total MBNL expression relative to newborn/postnatal day 0 (P0d) (top). Mean MBNL expression for five species at each developmental stage (bottom). Significant differences between MBNL1 and MBNL2 expression at different developmental stages were determined by a two-tailed t-test; **P < 0.01. b, Strong positive correlation between Mbnl gene expression in developing WT mouse cortex and mean |ΔPSI | for MBNL-sensitive AS events (top) and miEs only (bottom) in SFARI genes. Black diagonal lines are the linear regression lines, and light gray areas are the 95% confidence intervals. P value for a two-tailed test. c, Splicing change in the developing mouse cortex for four MBNL-sensitive AS events in high-confidence ASD-risk genes. Embryonic days 14.5–16.5, postnatal days 0–30, and postnatal months 4–21 (n = 2 for each time point). d, Dmd miE splicing transitions during mouse cortical development. e, ASD-risk gene mis-splicing in Mbnl1 KO (n = 2), Mbnl2 KO (n = 2) and Mbnl cDKO (n = 2) mouse E18.5 d cortical neurons. Box plot shows the lower, middle and upper quartiles. Whiskers show minimum and maximum. Kruskal–Wallis test followed by Dunn’s multiple comparison test (n, mis-spliced AS events); *Padj < 0.05, ***Padj < 0.001, ****Padj < 0.0001. f, Dmd miE mis-splicing in embryonic Mbnl cDKO (n = 2) versus WT (n = 2) RNA-seq. g, ASD-risk gene set enrichment analysis for mis-spliced genes in DM1 brain organoid. Diamonds represent the OR. Error bars depict the 95% confidence interval. h, DMD miE mis-splicing in in DM1 (n = 4) versus CTRL (n = 4) brain organoid RNA-seq. Data are presented as mean ± s.d. (a,c,f,h). *FDR = 0.018, ***FDR = 0.00026, ****FDR < 0.0001 (g,h).

