
FIGURE 6.
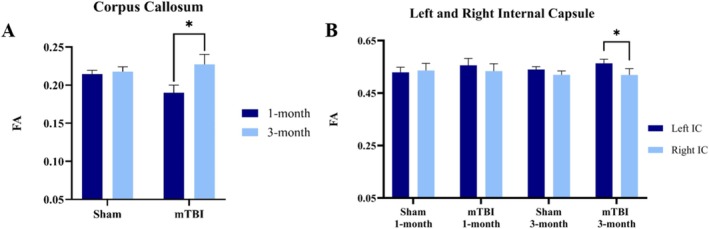
FA changes in corpus callosum and internal capsule post‐mTBI. (A) FA changes in the corpus callosum between 1‐ and 3‐month post‐injury. The graphs depict the mean differences between mTBI and sham groups at the two time points. mTBI group shows a significant increase in FA from 1‐ to 3‐month post‐injury. (B) The comparison of FA values between left and right internal capsule for both group and each time point. At 3‐month post injury, the FA values in the right internal capsule are significantly lower compared with the left one in the mTBI group (mTBI, n = 6; sham, n = 6; avg ± SEM; Student's t‐test, *p < 0.05).