
FIG. 8.
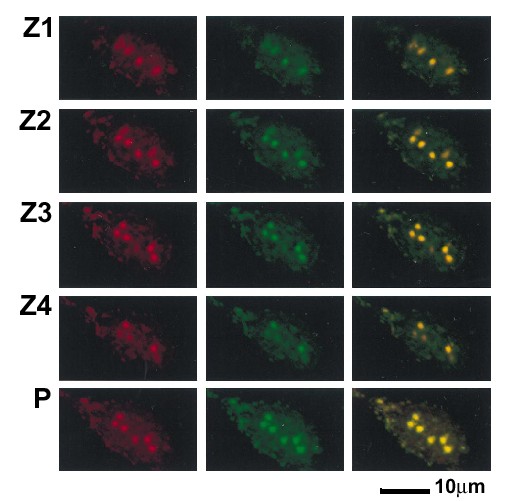
Assessment of Tax and RelA colocalization. Images from horizontal sections (Z series) were collected from a specimen of BHK21 cells infected with SFV-Tax. The cells were analyzed by dual immunofluorescence staining with antibodies to Tax and RelA. Z1 to Z4 are four of these sections, which were collected with 1-μm intervals. P is the projection of the Z series. The left panel displays the LRSC fluorescence of Tax, the middle panel displays the FITC fluorescence of RelA, and the right panel is the overlay of the red and green fluorescence staining.