FIG. 5.
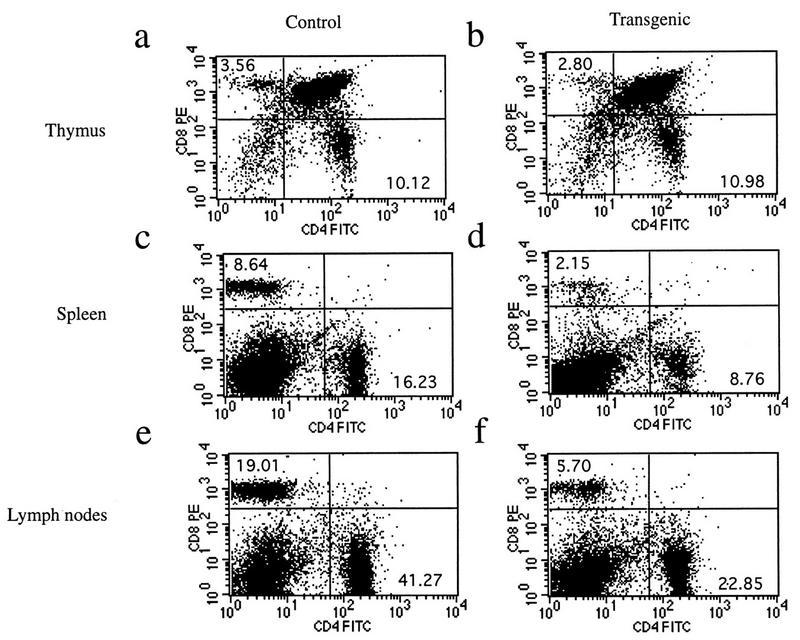
Transgenic animals show a reduction in the peripheral T-cell compartment. Flow-cytometric analysis of 7-week-old control and transgenic mice is shown. Cell suspensions from thymus (a and b), spleen (c and d), and lymph nodes (e and f) were analyzed for the expression of CD4 and CD8 surface markers. Numbers in each quadrant represent subpopulation percentages. These plots are representative of several experiments. The total cell counts in the thymus, spleen, and lymph nodes of control and transgenic mice are as follows: thymus, (9.6 ± 4.4) × 107 (control) and (14.1 ± 5.7) × 107 (transgenic) (n = 25 animals per genotype); spleen, (7.2 ± 1.1) × 107 and (7.5 ± 2.1) × 107 (n = 14); lymph nodes, (6.0 ± 1.4) × 107 and (4.7 ± 2.0) × 107 (n = 2).

