
Figure 2.
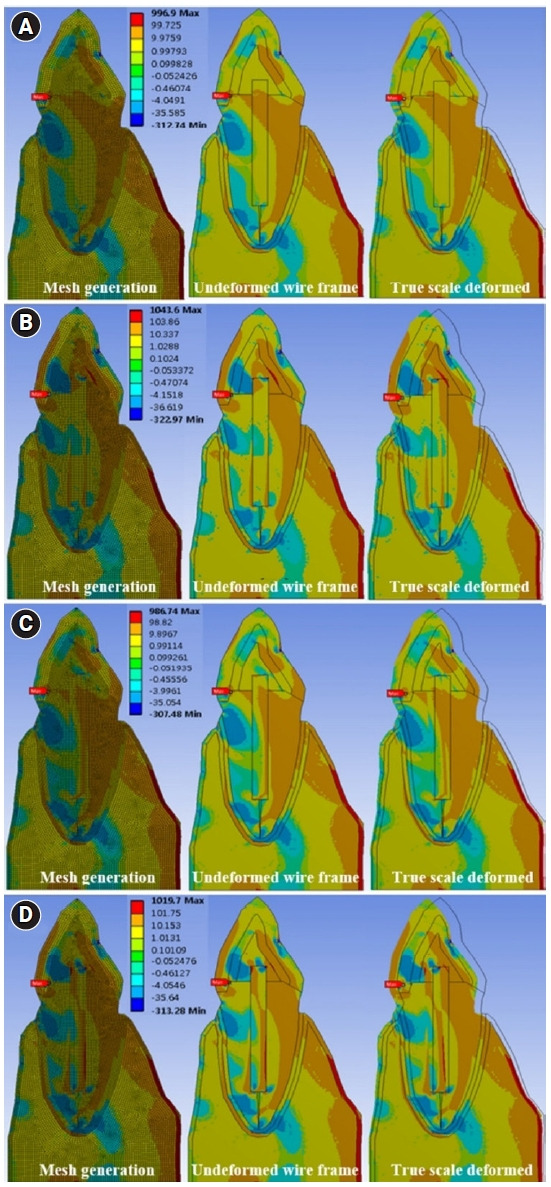
Maximum principal stress distribution across the tooth model under load conditions. (A) Maximum stress of tooth model with bonded fiber-reinforced composite (FRC) post under load. (B) Maximum stress of tooth model with non-bonded FRC post under load. (C) Maximum stress of tooth model with bonded titanium (Ti) post under load. (D) Maximum stress of tooth model with non-bonded Ti post under load.