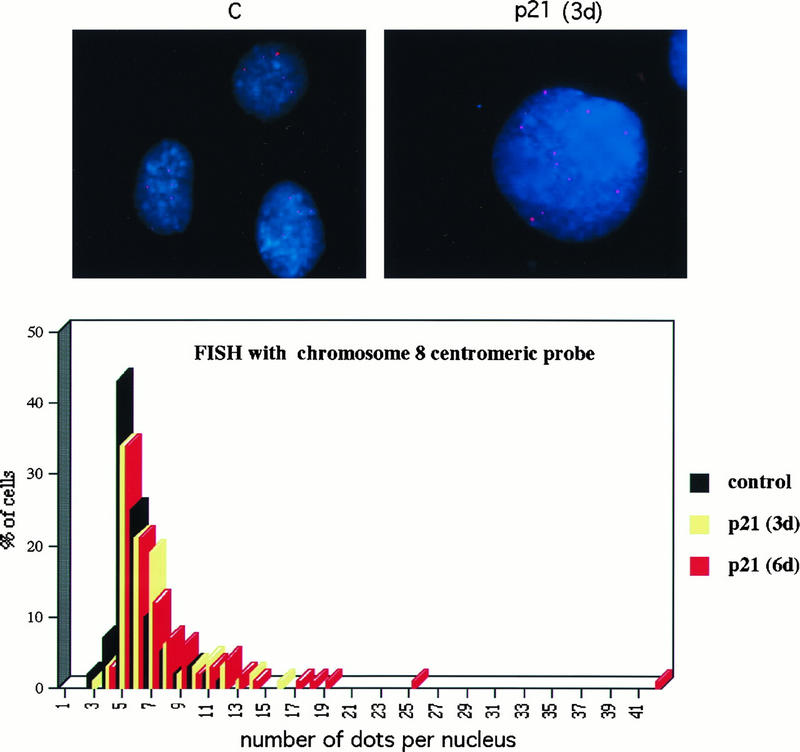
FIG. 6.
(A) FISH analysis of Saos2 cells with a Chromosome 8 centromeric probe. Images were taken with a 63× oil immersion objective, as described in Materials and Methods. Preparations of nuclei were obtained by hypotonic lysis of cells. Chromatin is stained blue with 4′,6-diamidino-2-phenylindole (DAPI), and the Cy3 fluorescent centromeric probe hybridized to its target appears as pink dots. The left panel shows nuclei from uninduced control cells; the right panel shows an example of a nucleus with an increased number of dots after 3 days of p21 expression. (B) Scoring of a time course experiment. A total of 100 nuclei in each sample, examined with a 63× objective, were scored for the number of dots.

