
Figure 3.
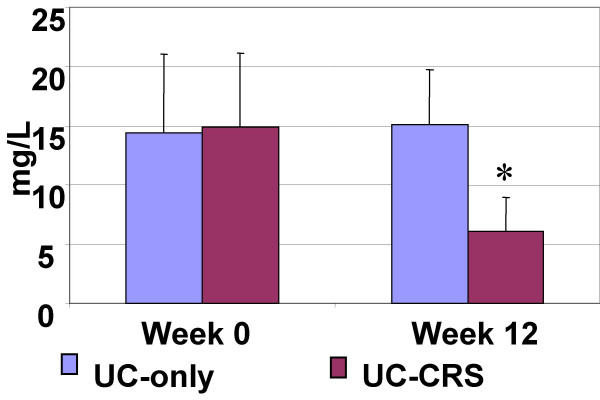
Serum C reactive protein. Bars stand for serum levels of C reactive protein. Data were presented mean ± SD. t test was performed with the data before and after FESS. *, p < 0.05, compared with UC-only group. UC-only: patients with UC only. UC-CRS: patients with both UC and CRS.