
Figure 7.
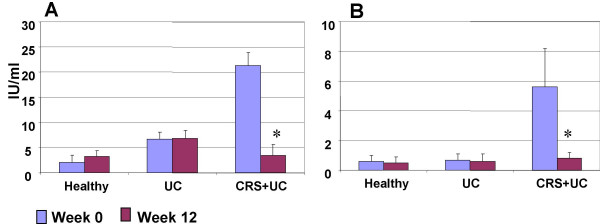
Serum IgE antibody. Serum samples were collected from all the subjects at week 0 and week 12. IgE levels were evaluated with ELISA. Data were presented as mean ± SD. *, p < 0.05, compared with the same group at week 0. A, serum total IgE; B, serum anti-SEB IgE.