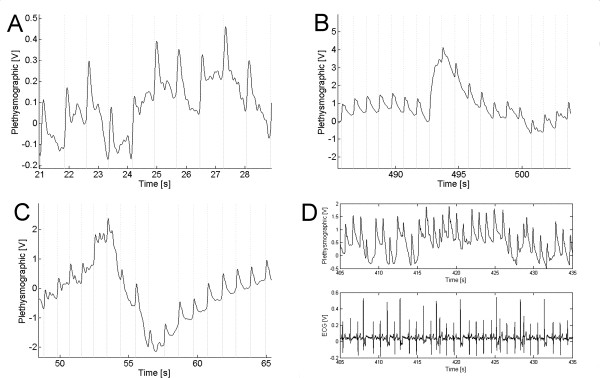
Figure 5.
Several signals and the results of the algorithmic process. Vertical lines mark the beginning (dotted) and end (dashed) of each cycle. (A) Patient with Parkinson disease; (B) Deflation of the cuff; (C) Inflation of the cuff. The two latter in the same patient. Section D shows the ECG and the plethysmographic signal from a patient with cardiac arrhythmia.

