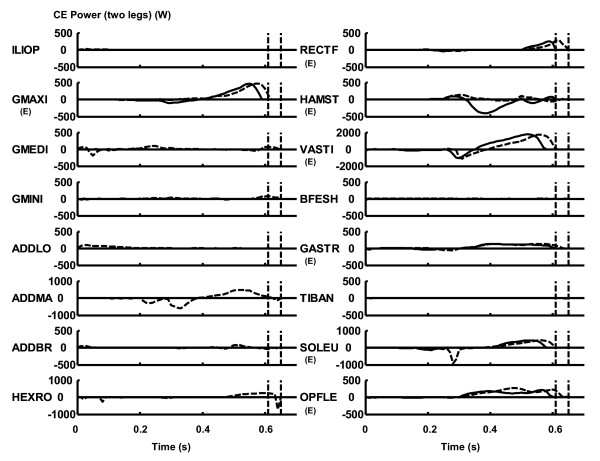
Figure 6.
The profile of the power output of the contractile element. The dashed curve represents the value for the "All Muscles" model, whereas the solid curve represents the value for the "Extensors Only" model. Positive is concentric and negative is eccentric. The dashed vertical lines represent the instant of take-off. The added values for two contralateral muscles are shown. The muscles whose primary function is leg extension (Table 1) are noted by (E).

