
FIGURE 6.
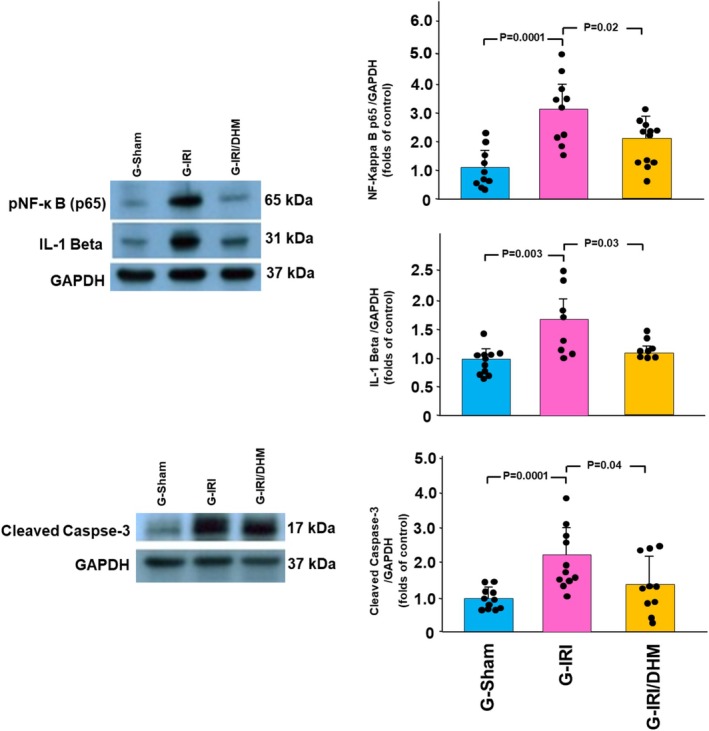
The protein expression of pNF‐κB p65, IL‐1β, and cleaved caspase‐3 (normalized to GAPDH protein expression) in all groups 3 days following the IRI/manipulation. Values are expressed as the ratio of mean ± SD relative to the Sham group.
Official websites use .gov
A
.gov website belongs to an official
government organization in the United States.
Secure .gov websites use HTTPS
A lock (
) or https:// means you've safely
connected to the .gov website. Share sensitive
information only on official, secure websites.
The protein expression of pNF‐κB p65, IL‐1β, and cleaved caspase‐3 (normalized to GAPDH protein expression) in all groups 3 days following the IRI/manipulation. Values are expressed as the ratio of mean ± SD relative to the Sham group.