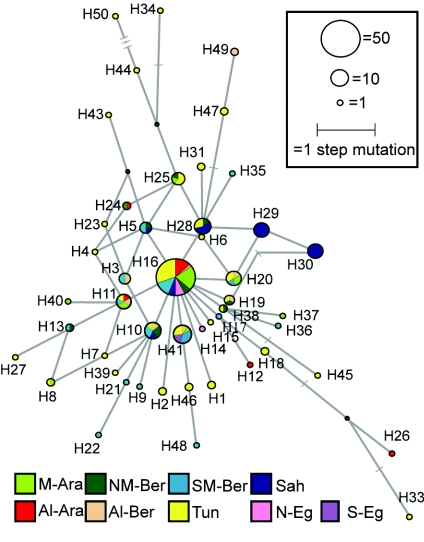
Figure A1.
Network of haplogroup E3b2*(xE3b2a) microsatellite haplotypes in North Africa. Circles represent haplotypes; their areas are proportional to their frequencies in the total North African sample, and their colors indicate the population of origin. Population codes are reported in table 1 and fig. 1. Lines across the network branches represent haplotypes that were not observed.

