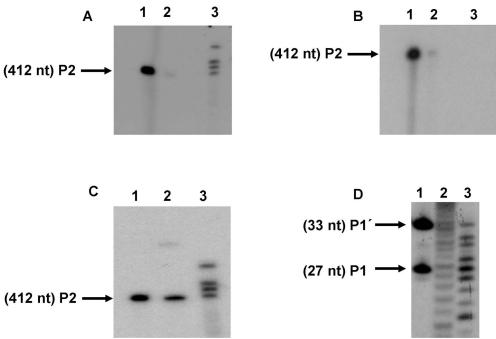
Figure 4.
Biochemical characterization of HCV RNase III cleavage product end-groups. S1 was internally labeled at low specific radioactivity and cleaved with RNase III. P2 purified from the gel was subjected to different specific enzymatic reactions to determine chemical groups of the (A): 3′ end. Lane 1, P2 labeled with [32P]pCp and T4 RNA ligase; lane 2, P2 alone; lane 3, control bands resulting from a standard reaction of RNase III on S1. (B) 5′ End. Lane 1, P2 central product band labeled with T4 polynucleotide kinase and [γ-32P]ATP after treatment with alkaline phosphatase; lane 2, P2 was identically treated as before without prior incubation with alkaline phosphatase; lane 3, P2 untreated. (C) 3′ and 5′ ends by P2 product circularization: lane 1, P2 alone; lane 2, P2 circularization with T4 RNA ligase. The band that corresponds to circularized P2 migrates more slowly than the starting material; lane3, standard RNase III reaction. (D) Coincident mobility of the 5′-terminal RNase III and nuclease P1 cleavage products of substrate S1 5′ Cap labeled S1 incubated with: lane 1, RNase III (the positions of the products P1 (27 nt) and P1′ (33 nt) are indicated by arrows); lane 2, OH− hydrolysis; lane 3, nuclease P1 treatment.

