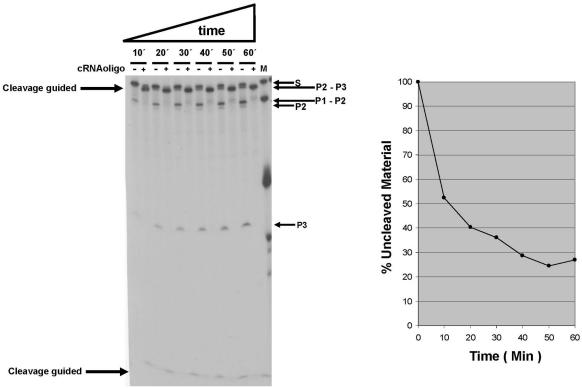
Figure 7.
The 5′ and 3′ cleavages in HCV RNA occur in a single structural motif. Kinetic analysis of E.coli RNAse III cleavage of HCV RNA in the presence or absence of a complementary RNA oligonucleotide. Left panel: autoradiogram of RNase III cleavage of internally labeled S1 HCV RNA transcript in the presence (+) or in the absence (−) of a synthetic RNA oligonucleotide complementary to HCV nt 23–43 (5′-GGAGUGAUCUAUGGUGGAGUG-3′). HCV RNA substrate (0.6 nM final concentration) was pre-heated at 90°C for 1 min, before the addition of reaction buffer [10 mM HEPES–KOH, pH 7.5, 10 mM Mg(OAc)2 and 100 mM NH4(OAc)] and left to cool down to room temperature. Cleavage reactions were performed with 20 U RNAsin, and 0.0005 U/µl (final concentration) of E.coli RNase III, in the presence of 1 µg/µl of yeast tRNA, and carried out at 37°C in a volume of 10 µl for 1 h. These optimal conditions were used in all of the experiments. In (+) reactions the synthetic complementary RNA oligonucleotide was added to a final concentration of 15 nM. Lane 13 (‘M’) contains RNA molecular weight markers composed of transcripts with a length of 82, 99, 110, 400 and 570 (S1) nt. Lanes starting from the left represent sequentially 10, 20, 30, 40, 50 and 60 min of incubation with RNase III without (−) or with (+) complementary RNA oligonucleotide. Cleavage products were separated on 4% denaturing polyacrylamide gels and visualized by autoradiography. The arrows on the left indicate the products of the RNase III cleavage directed by the complementary oligonucleotide and on the right; the products of RNase III alone (P1+P2, P2 and P3) are indicated. Quantitation was performed with a Radioisotopic Image Analyzer. Right panel: Graphic representation of the time course processing of S1 by E.coli RNAse III in the absence of the complementary RNA oligonucleotide.

