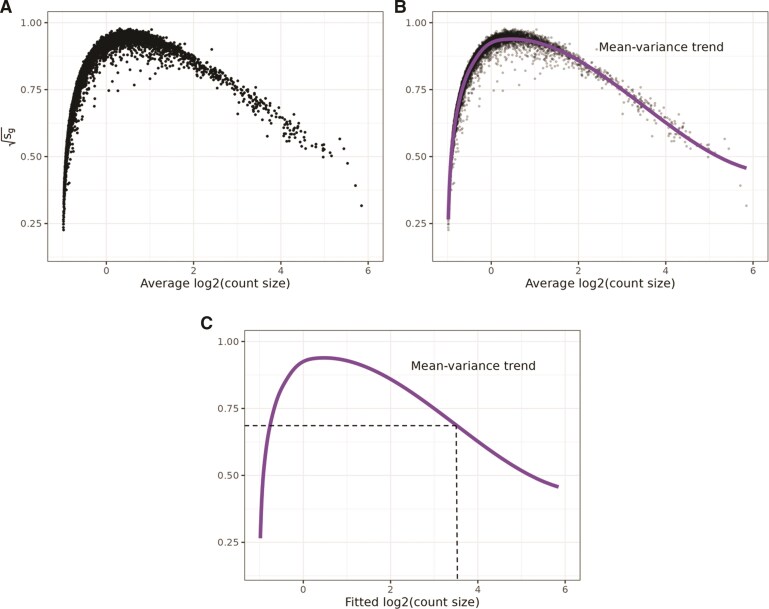
Fig. 1.
Calculating precision weights for individual observations. These data are from Invasive Ductal Carcinoma breast tissue analyzed with 10x Genomics Visium (10x Genomics 2022), hereafter referred to as “Ductal Breast.” A)–C) The square root of the residual standard deviations estimated using nearest neighbor Gaussian processes [ defined in (3)] are plotted against average logcount (
 ). B) Same as A, except a spline curve is fitted to the data to estimate the gene-wise mean–variance relationship. C) Using the fitted spline curve, each predicted count value (
 ) is mapped to its corresponding square root standard deviation value using
  .
.

