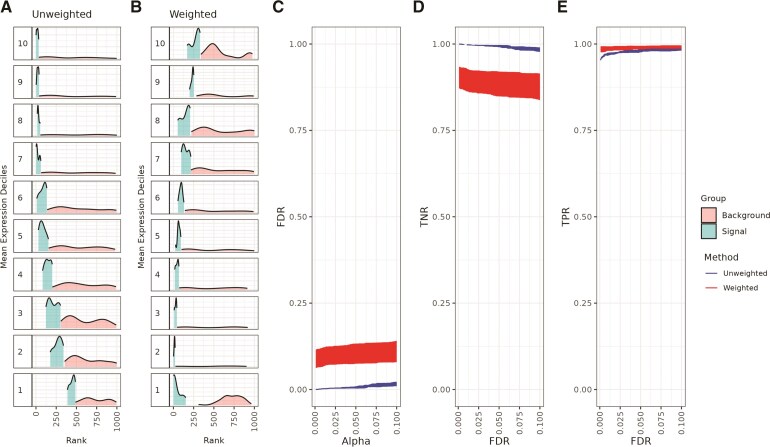
Fig. 4.
Spoon removes the mean–variance relationship when detecting spatially variable genes. This dataset consists of 1,000 simulated genes across 968 spots using a lengthscale of 100. Separately for unweighted and weighted methods, the genes were binned into deciles based on mean logcounts. Decile 1 contains the lowest mean expression values. Ridge plots for the A) unweighted ranks and B) weighted ranks are shown. Within each decile ( -axis), the density of the top 10% of ranks is plotted as the signal, while the density of the remaining ranks is plotted as the background. C) False discovery rate (FDR) as a function of Type I error (
 ). As a function of FDR, we show the D) true negative rate (TNR) and E) true positive rate (TPR). The red represents weighted nnSVG and the blue represents unweighted nnSVG. These plots represent the average performance across five iterations of the same simulation, each with unique random seeds.

